The Reporting tab houses the Facebook Ads Reporting section, where you can find statistical data for your existing Facebook Ads campaigns. Offering a swift and convenient solution, it allows you to access your Facebook Ads information without necessitating a visit to Facebook. The data is comprehensive, showing details at the campaign, adset, and ads level, along with demographic information to reveal the audience of your Facebook Ads!
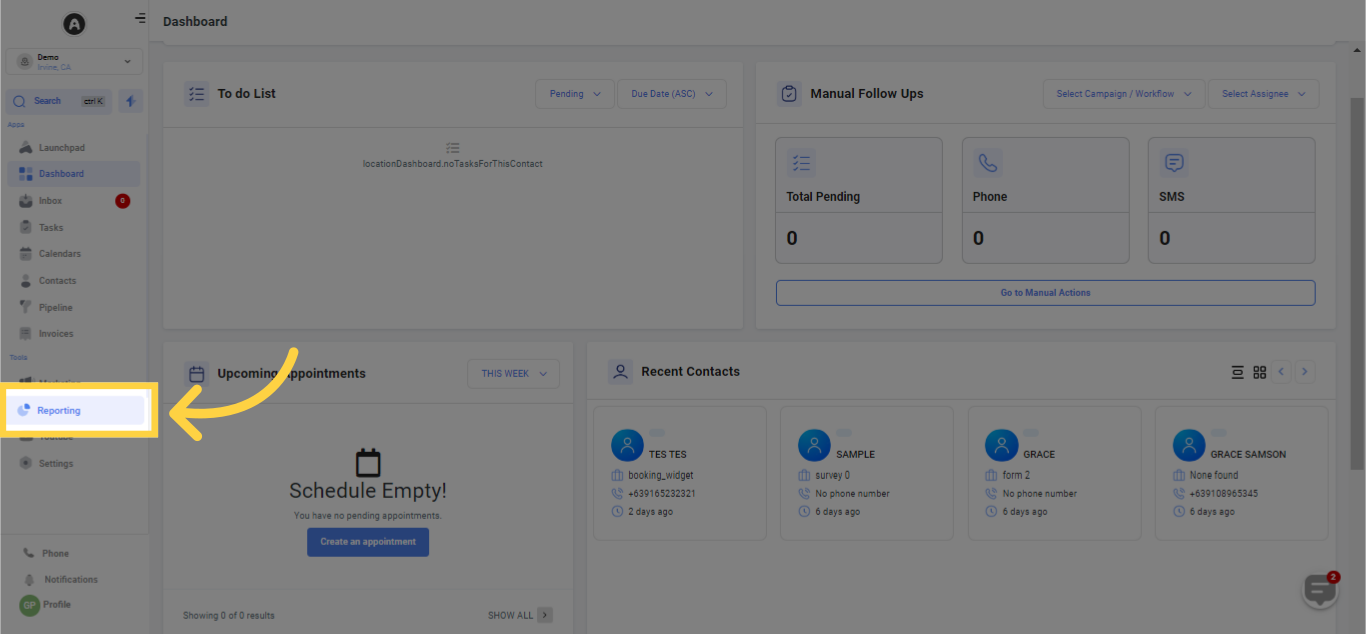
Your accessibility to all the components may be determined by your assigned user permissions.1. Select "Reporting"
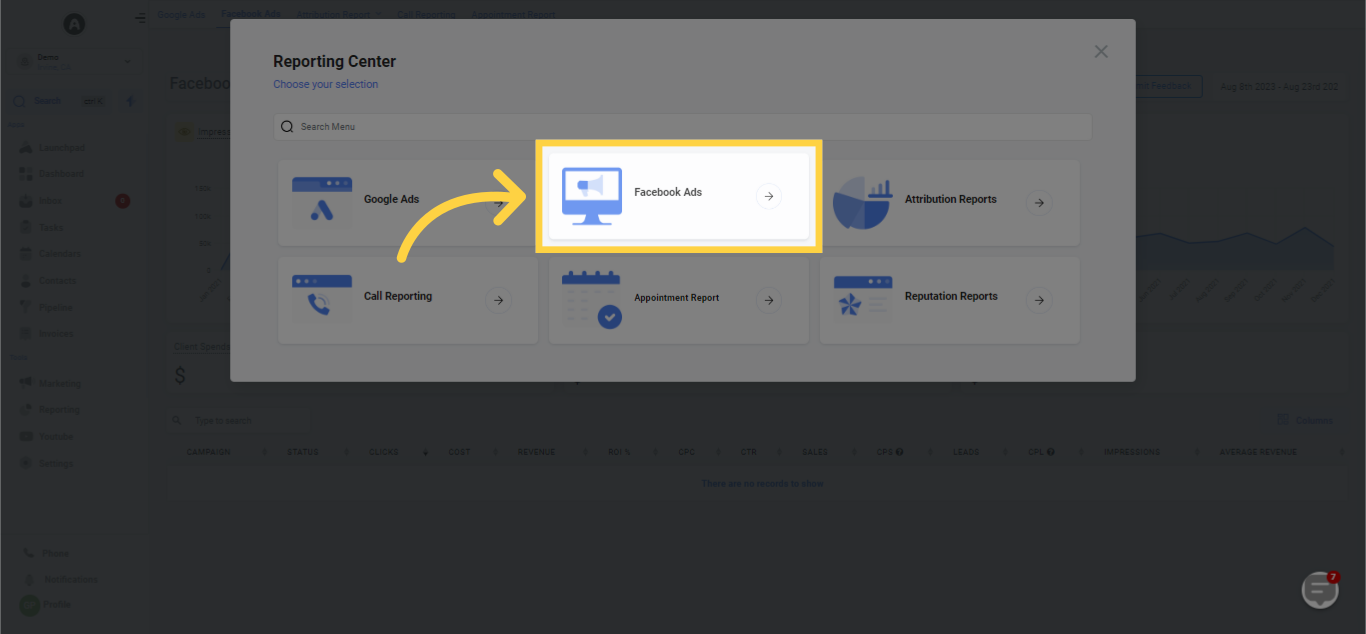
2. Select "Facebook Ads"
3. Sample Data & Integration Settings
You're examining sample data at present. To view your own Facebook Ads data, it's necessary to integrate your Facebook account and synchronize your Ads data.
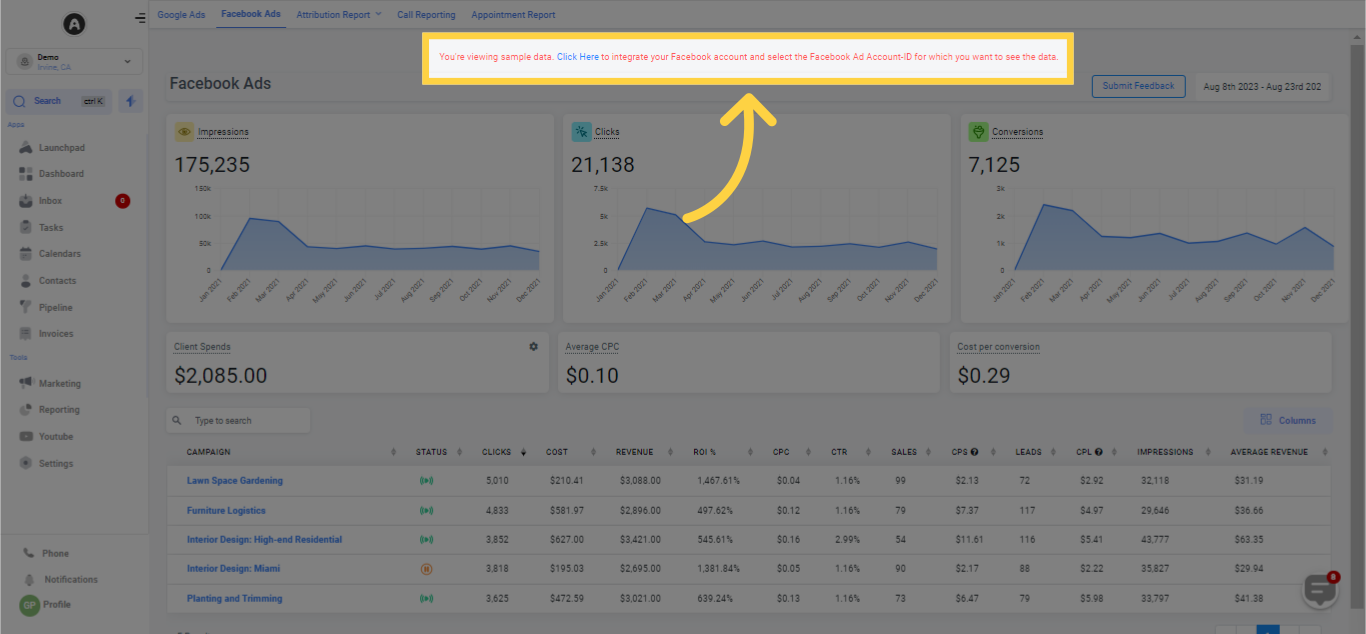
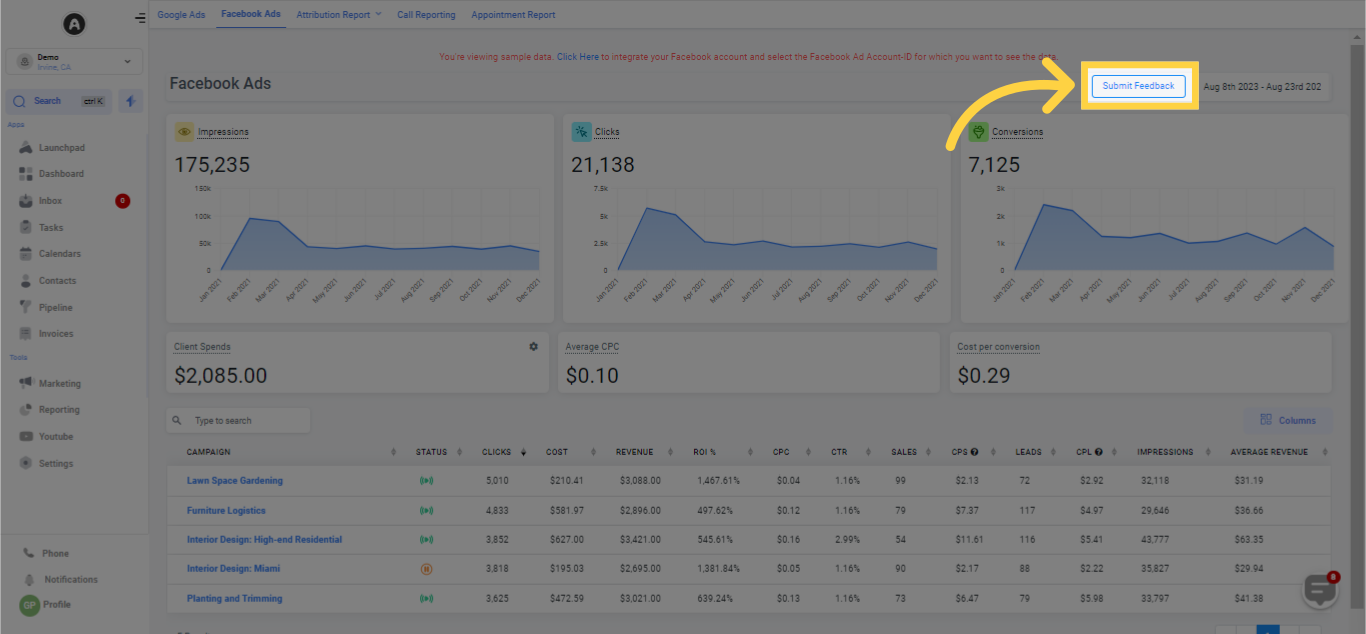
4. Click here to Submit Feedback
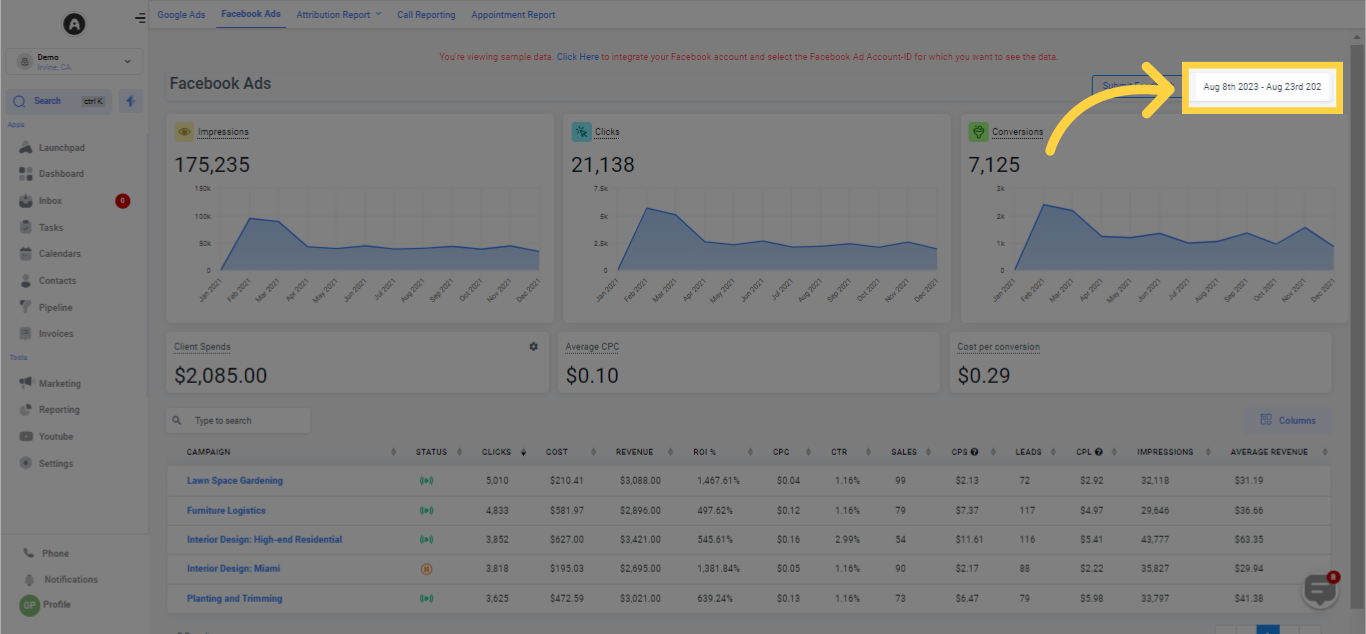
5. Select Date Range
For precise analysis of advertising data, applying filters and defining specific date ranges are critical. This helps in ensuring that the data under scrutiny is both pertinent and accurate. To set a date range, navigate to the calendar selector situated at the top right, choose your preferred dates, and then hit the green checkmark button. Doing so will update your Facebook Ads data to correspond with your selected date range!
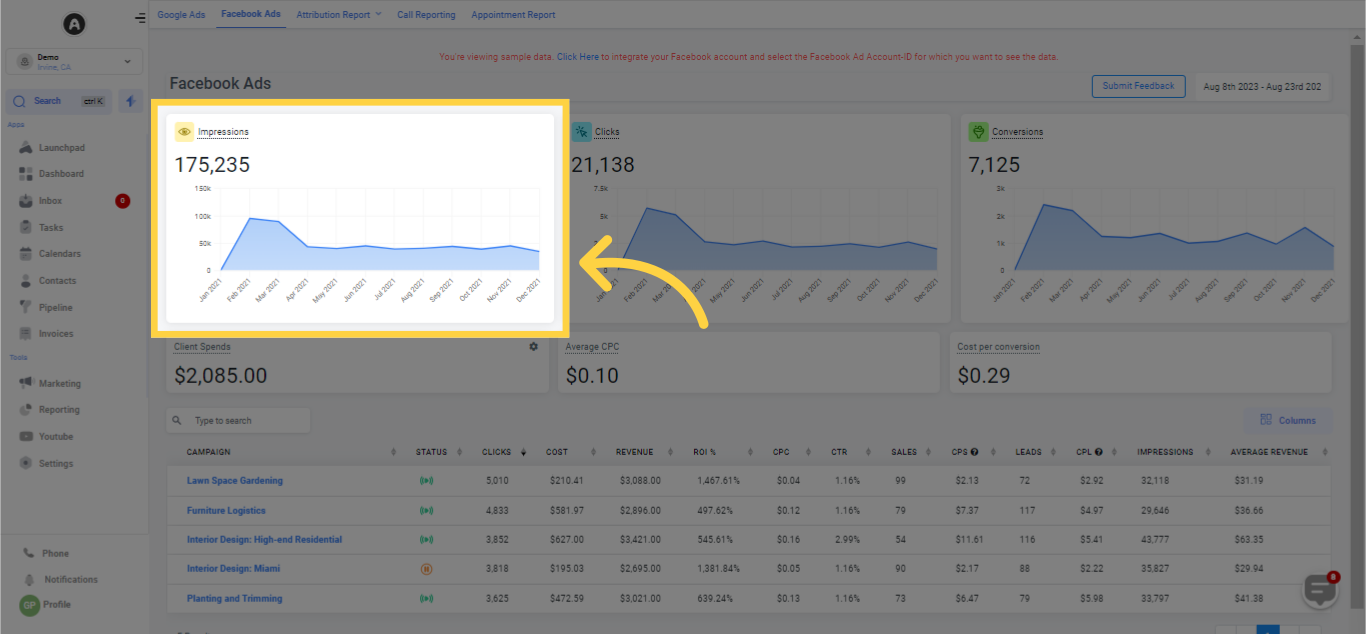
6. Campaign Impressions Timeline
In the Campaign Impressions Timeline section, you can observe a timeline of your total impressions at the campaign level, contingent on the chosen date range.
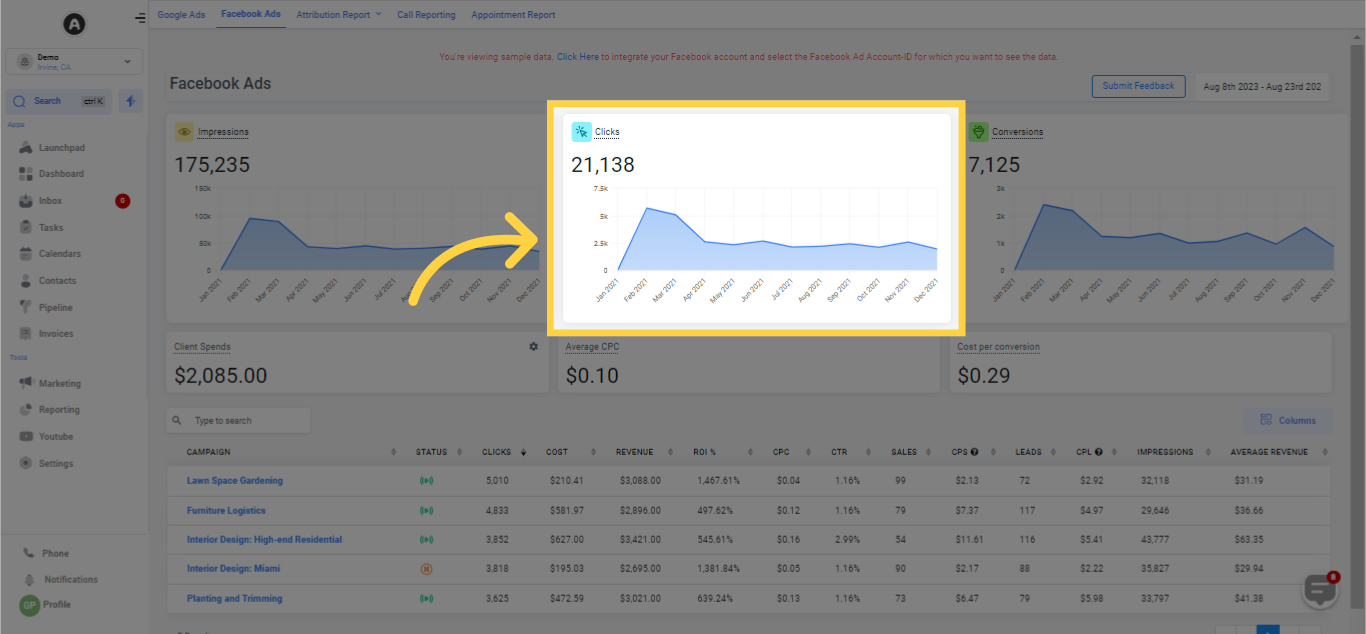
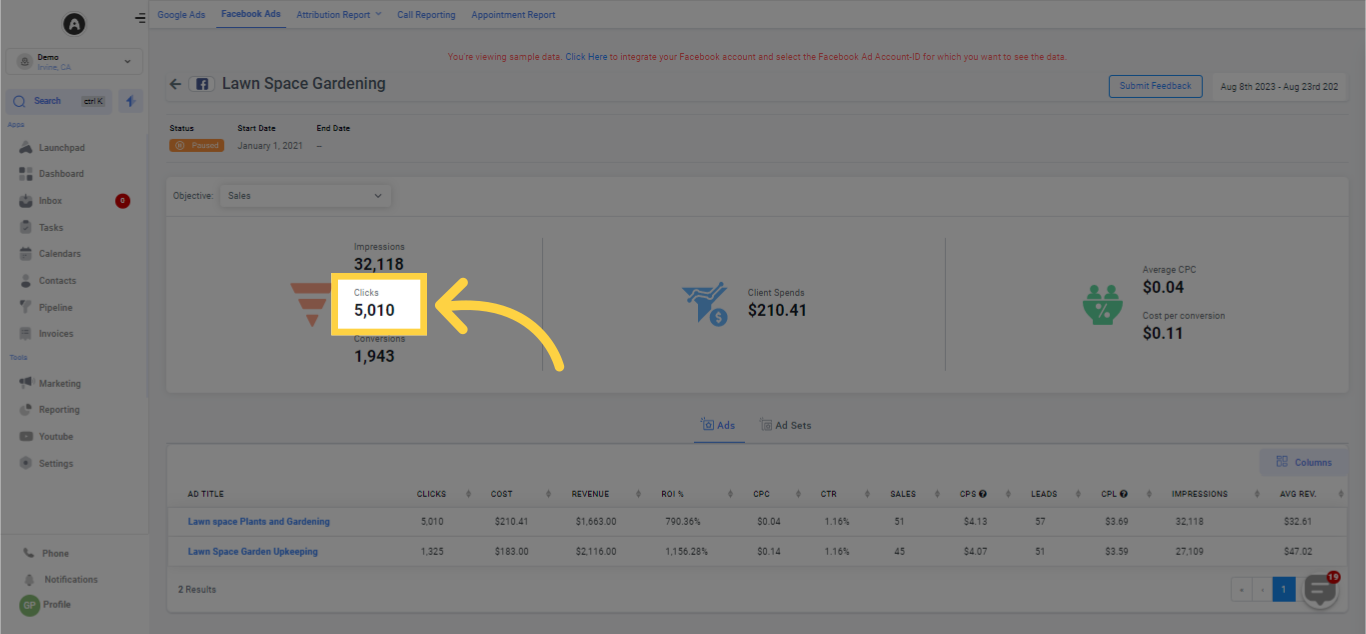
7. Clicks
The Clicks section indicates the number of times users clicked on your Facebook ad after it appeared on their search results page. This part also exhibits a graphical rendering of your clicks per day, week, or month according to the date range you've chosen.
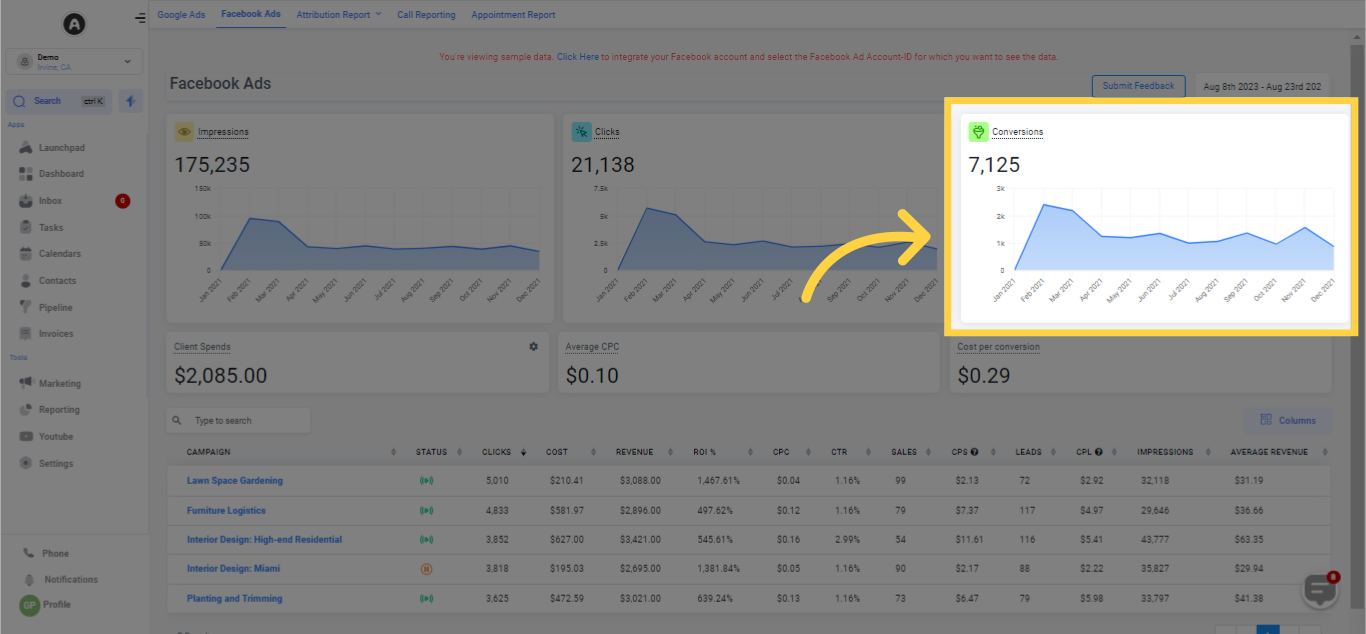
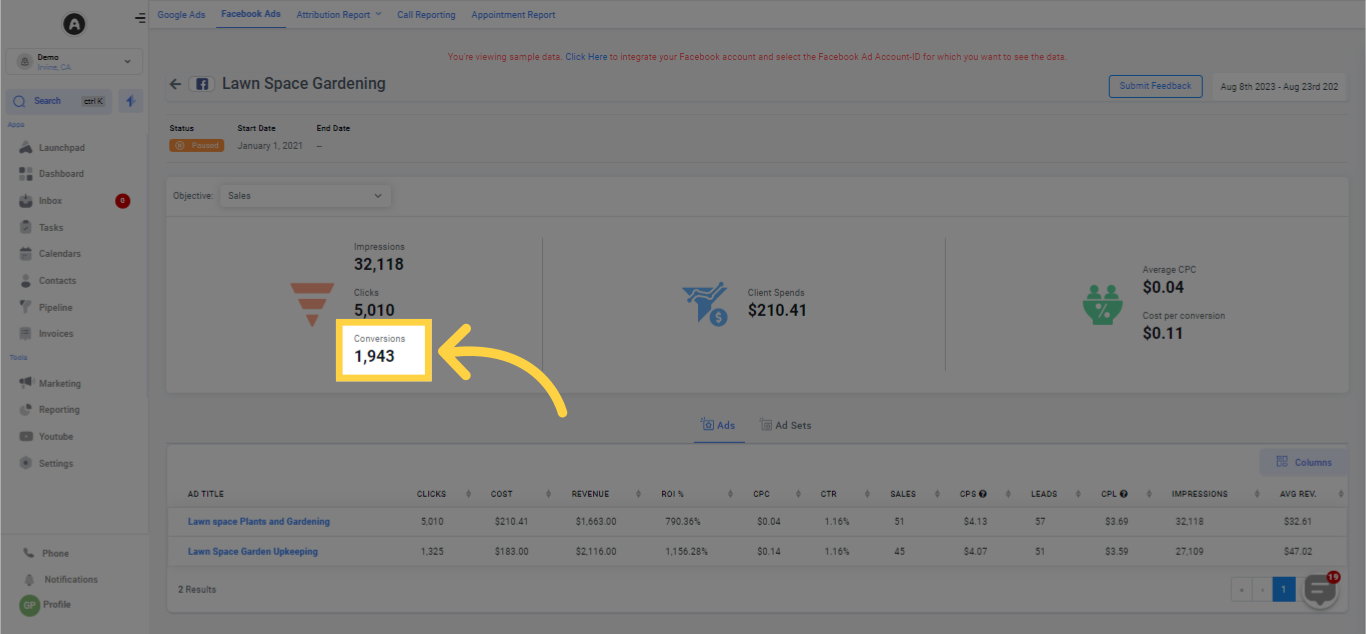
8. Conversions
Within the Conversions section, you'll identify the count of users who enacted a particular action aligning with your ad's goal during the set time window. Observe a graphical depiction of your conversions per day, week, or year according to the selected date range.
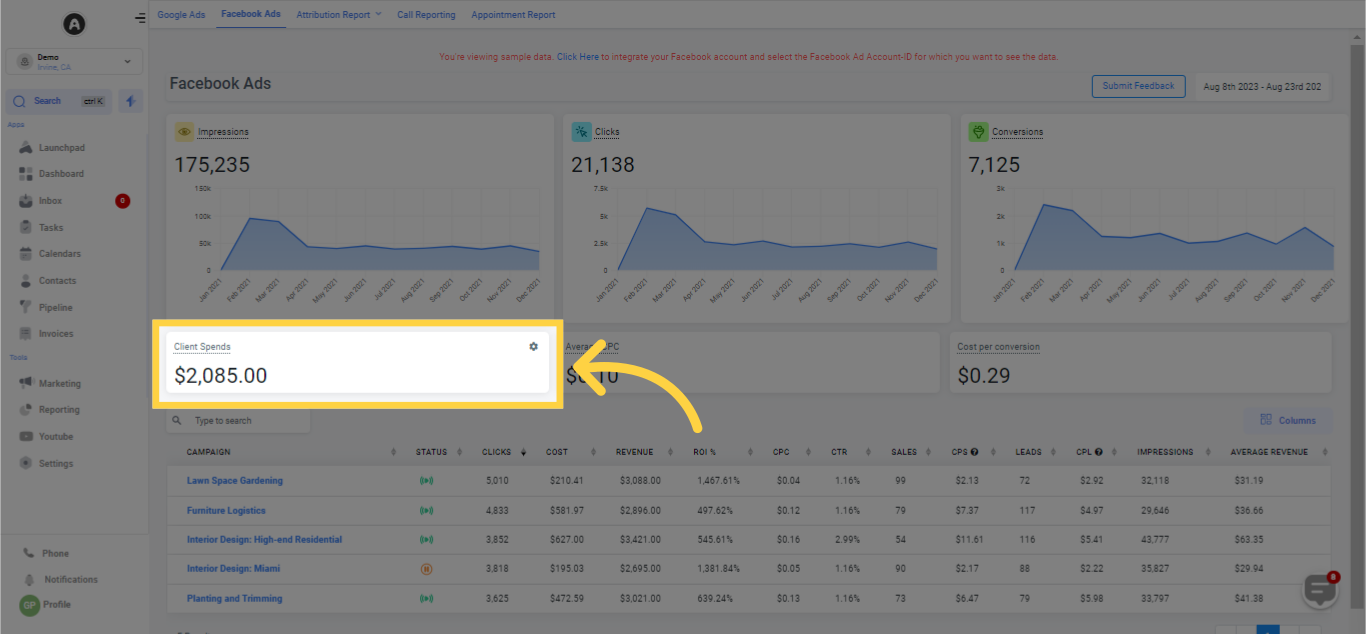
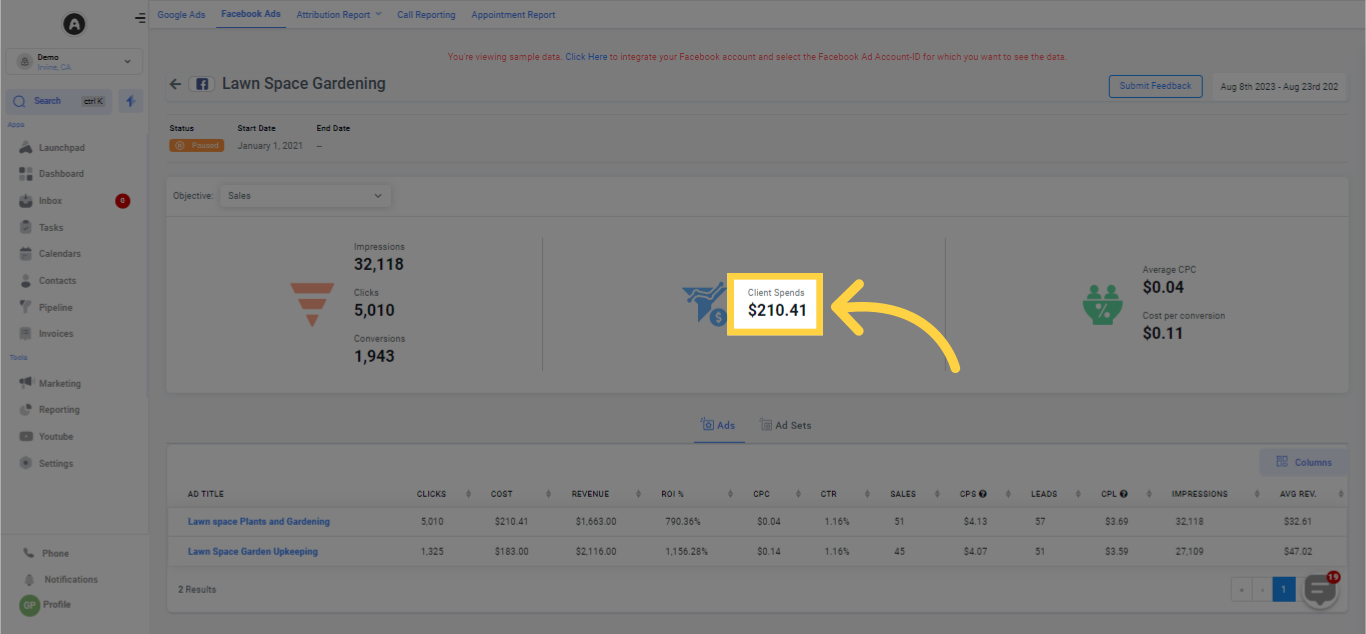
9. Client Spends
Displays the expenditure incurred on a particular advertisement.
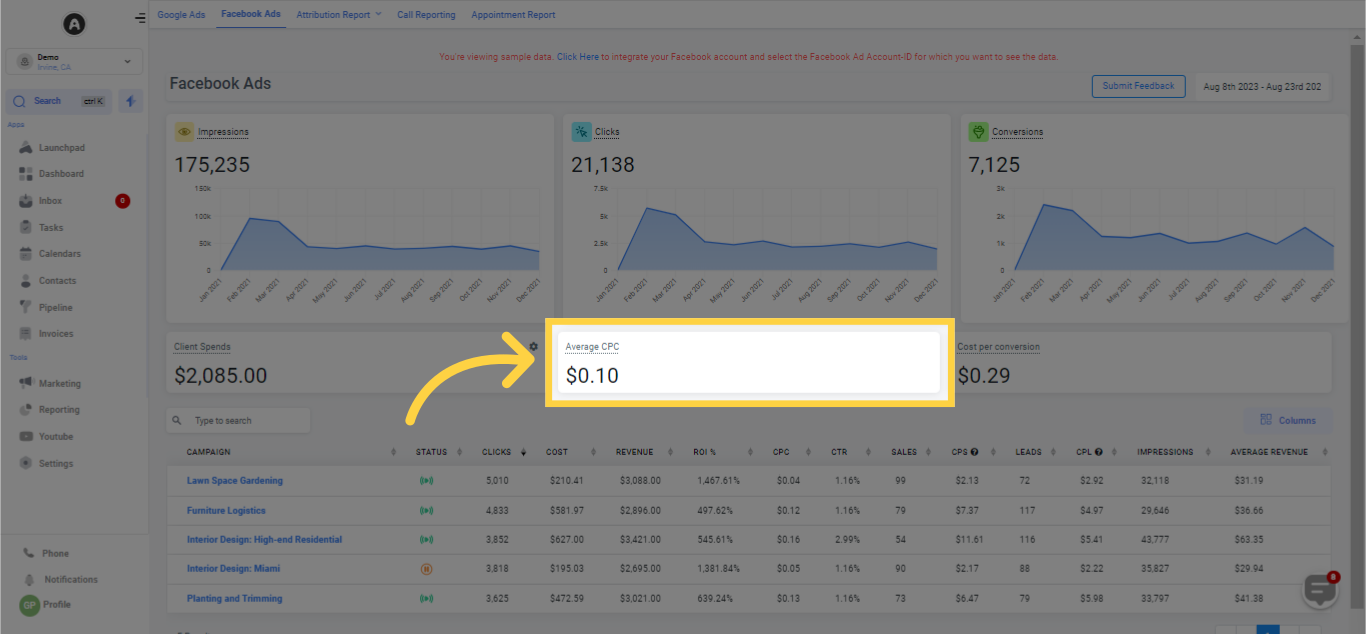
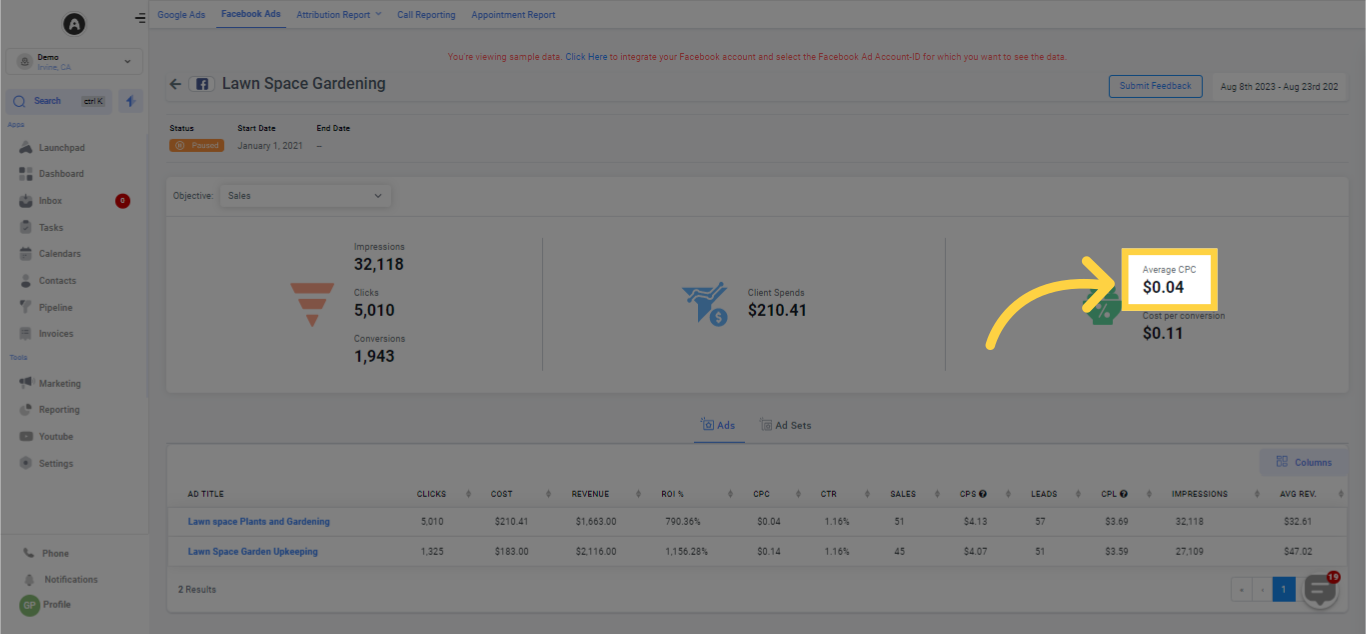
10. Average CPC
Indicates the average cost for each click.
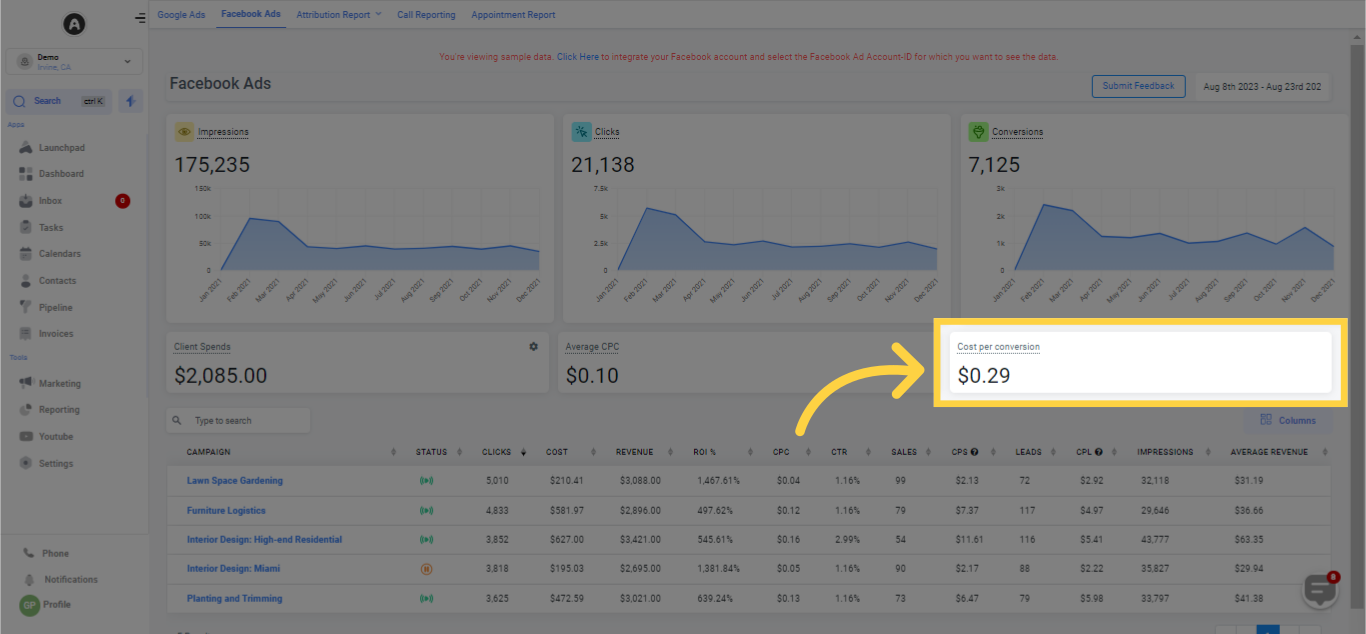
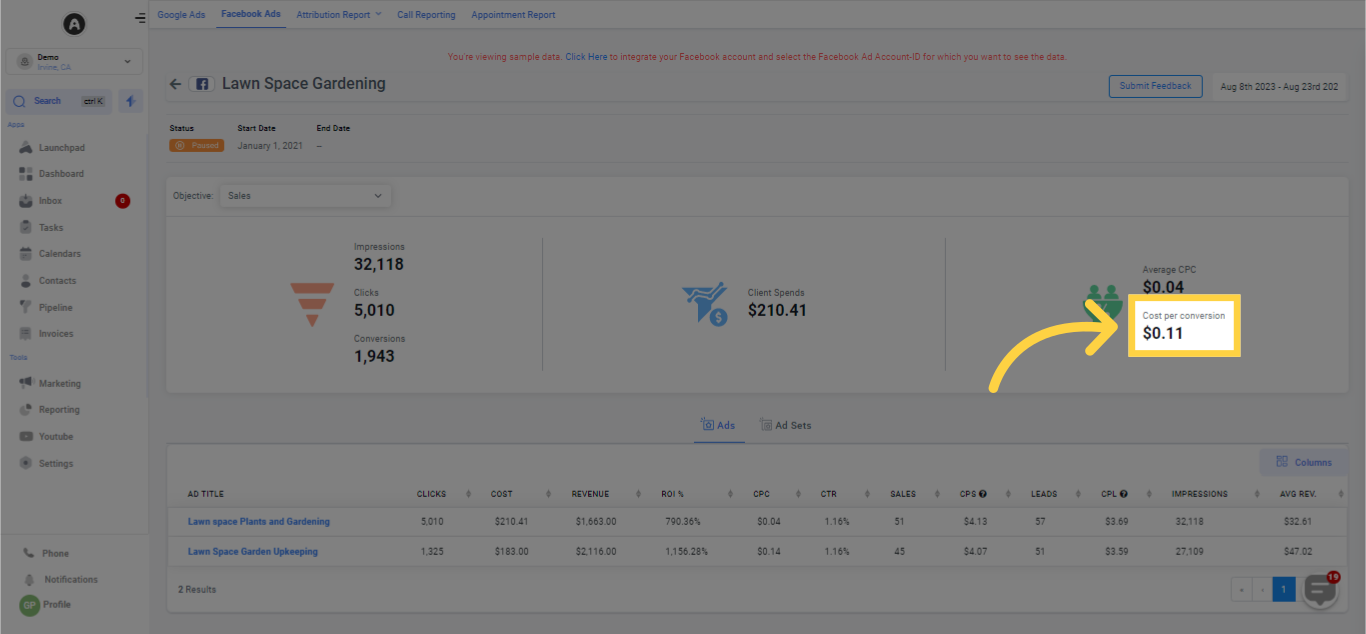
11. Cost per Conversion
Displays the average cost for each conversion.
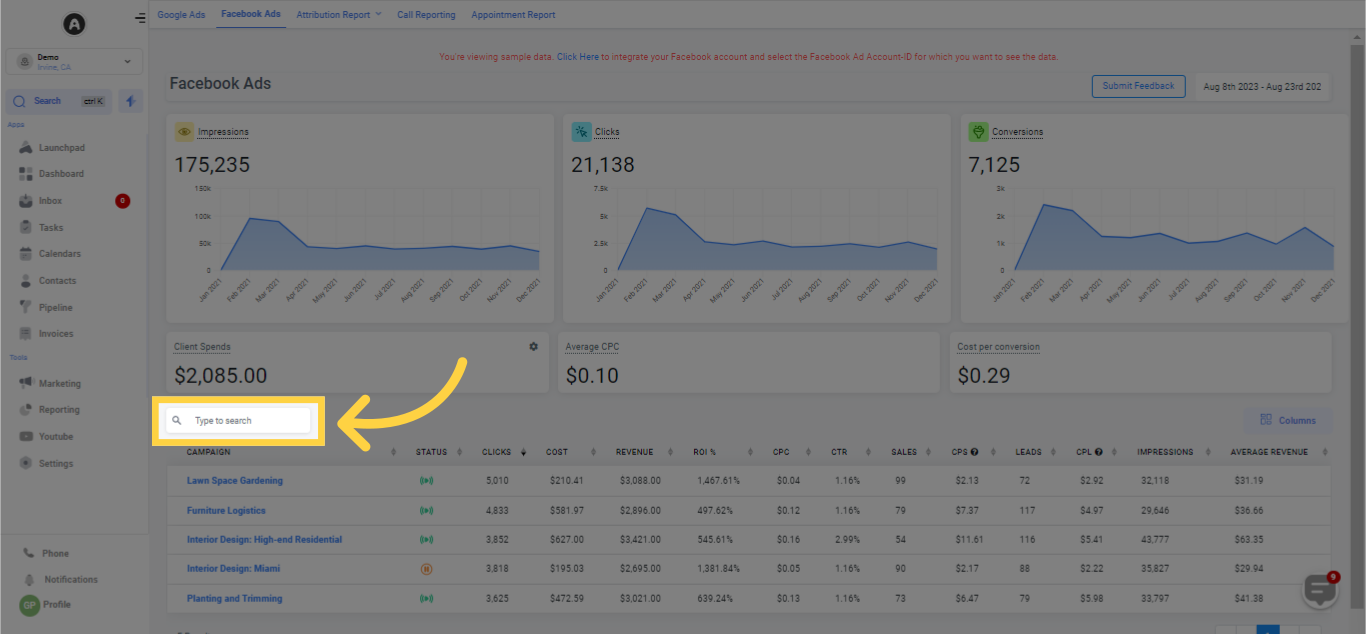
12. Search Bar
The Search Bar facilitates a swift retrieval of a specific Facebook ad campaign. Just enter the name of the campaign you wish to see, and the other campaigns will vanish from the campaign data card.
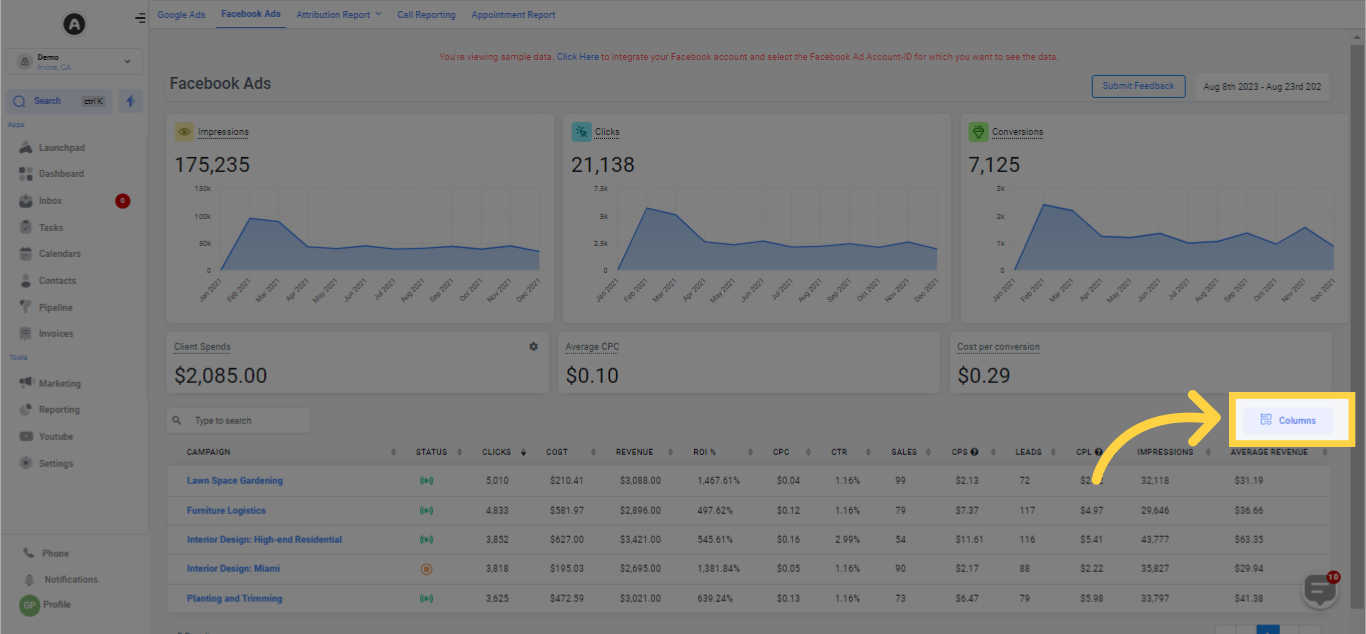
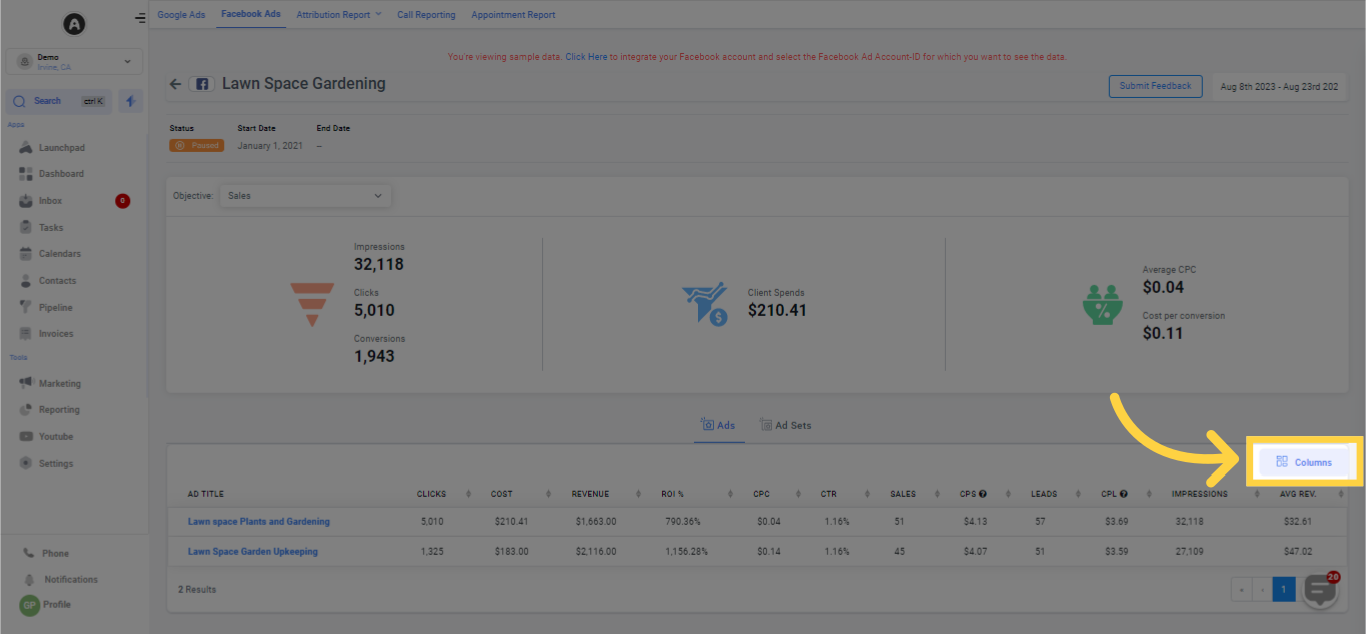
13. Click "Columns"
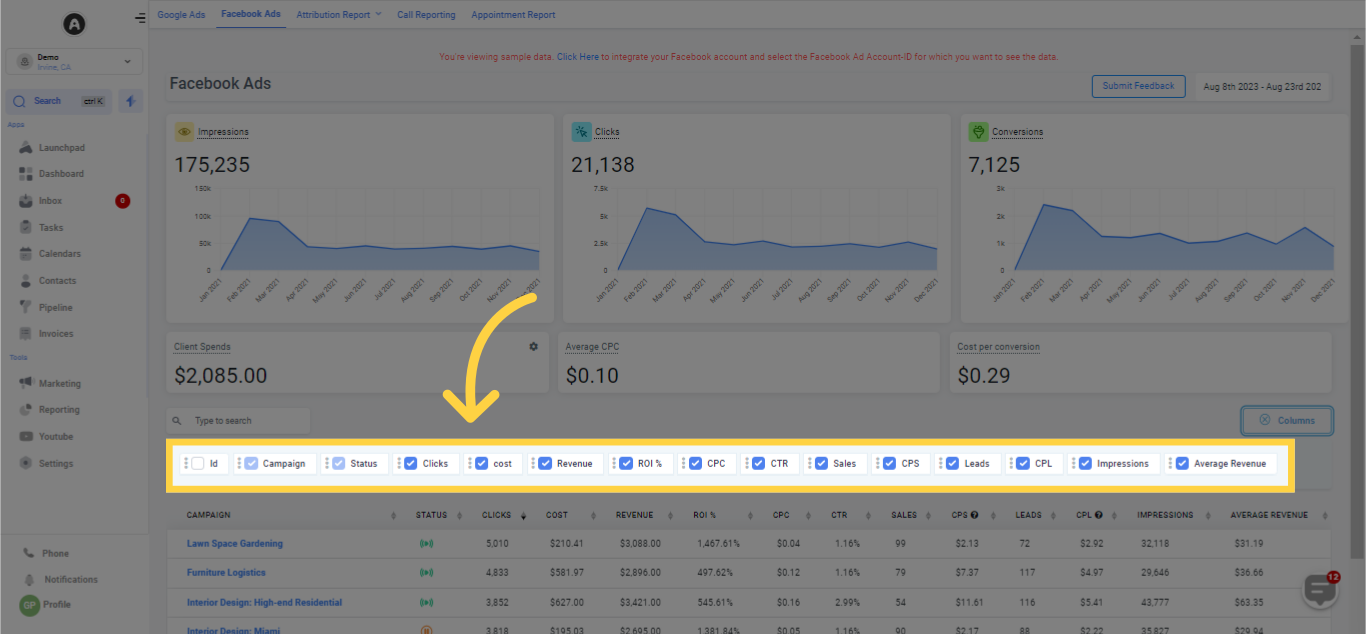
Within the Columns section, you have the flexibility to select the precise data you want to be shown by toggling the checkboxes. After making your choices, click on the column tab once more to preserve your adjustments.
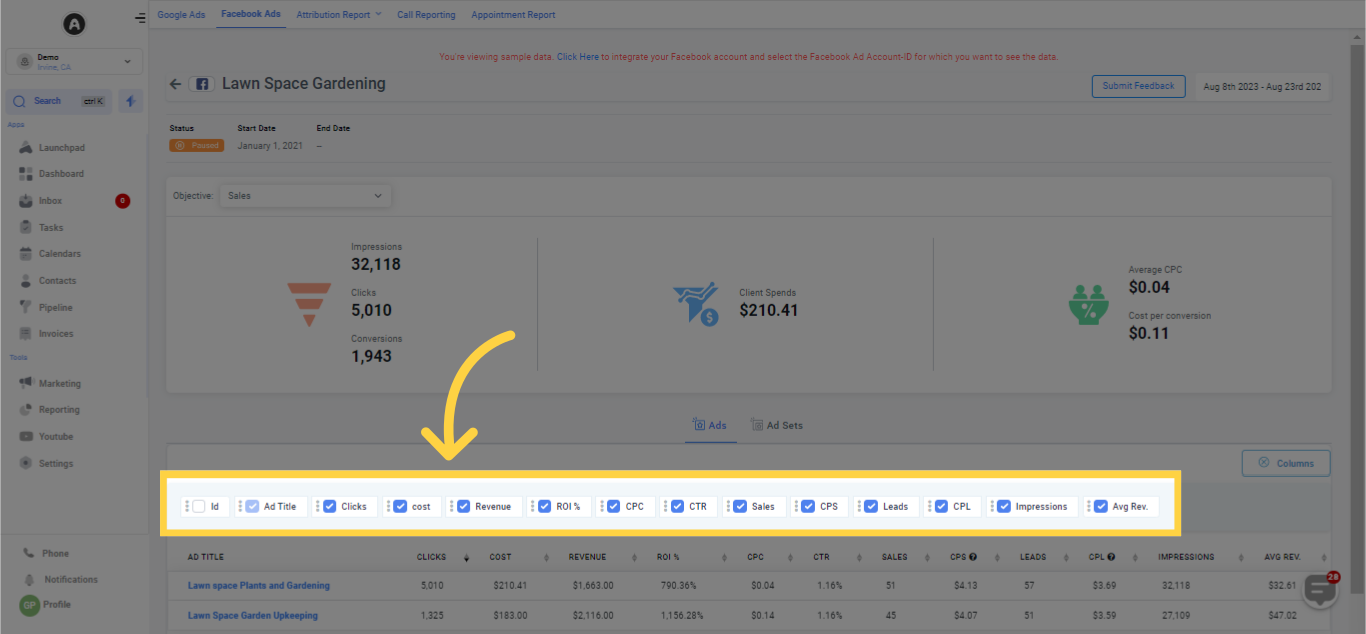
14. Column Options
15. Campaign List
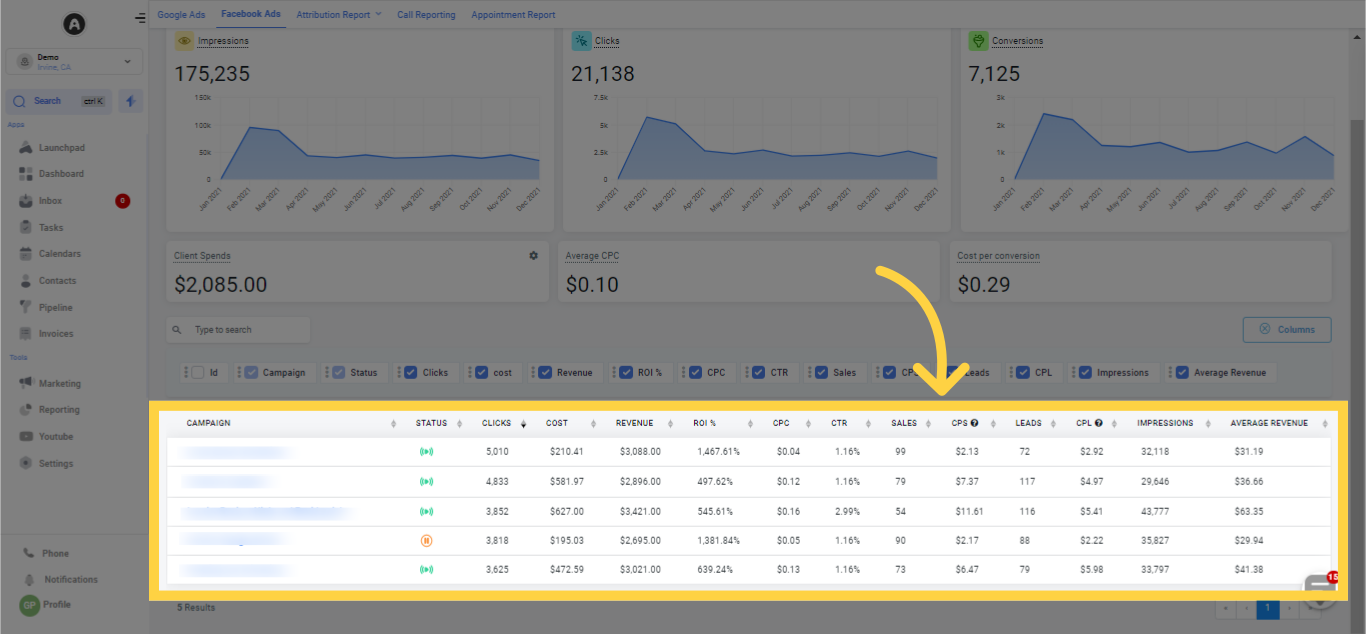
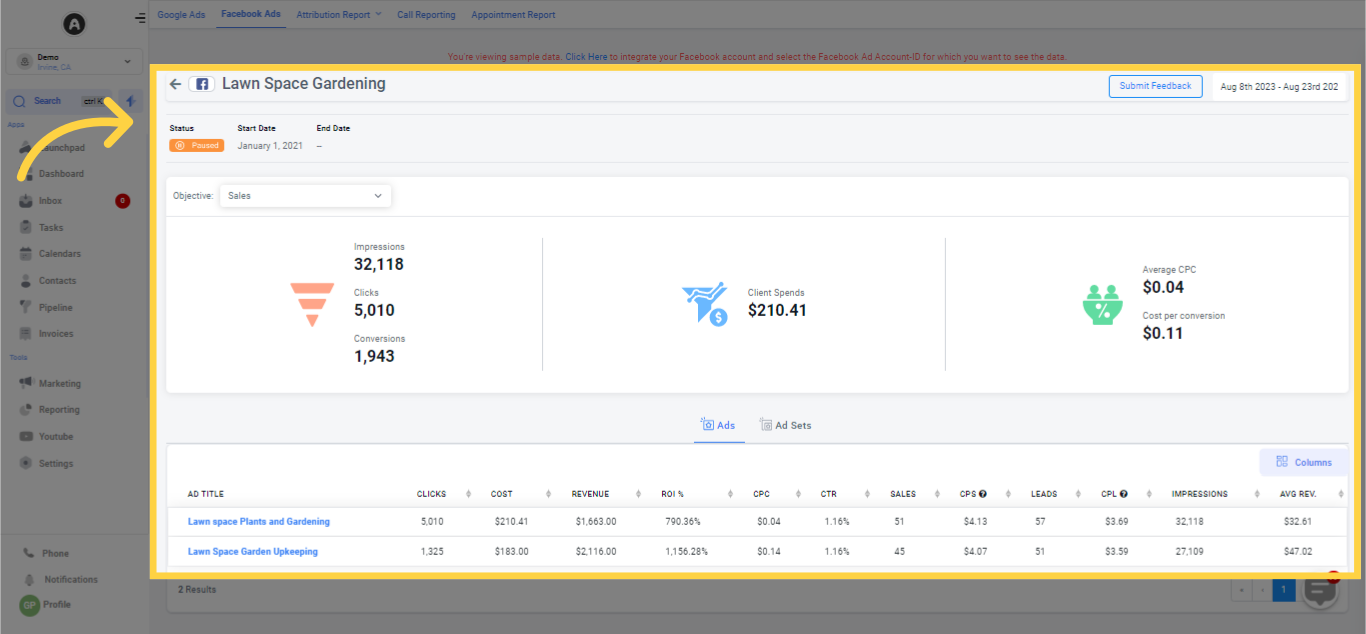
16. Campaign Reporting
By clicking on any campaign displayed in the reporting section, you'll open this tab where the statistics for the individual campaign you've selected from the list will be visible.
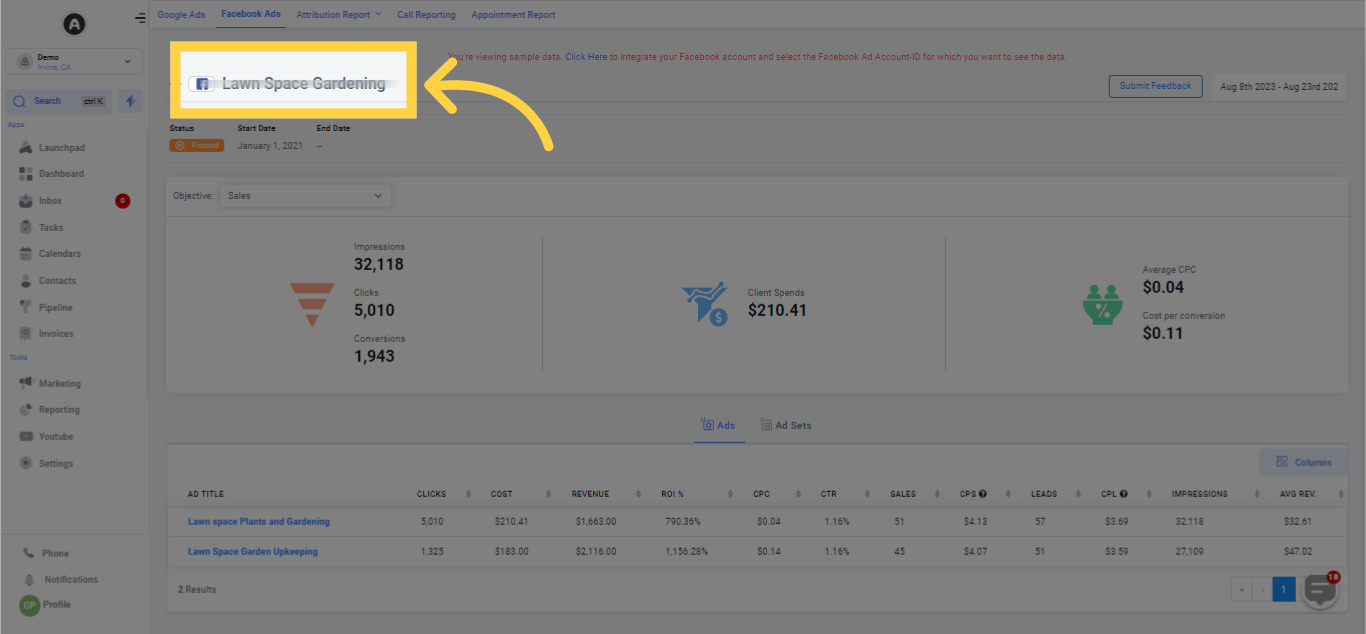
Campaign Name
The designation of the picked Facebook ad campaign is displayed here.
Status
In this section, you'll ascertain whether the selected Facebook ad campaign is currently live or paused.

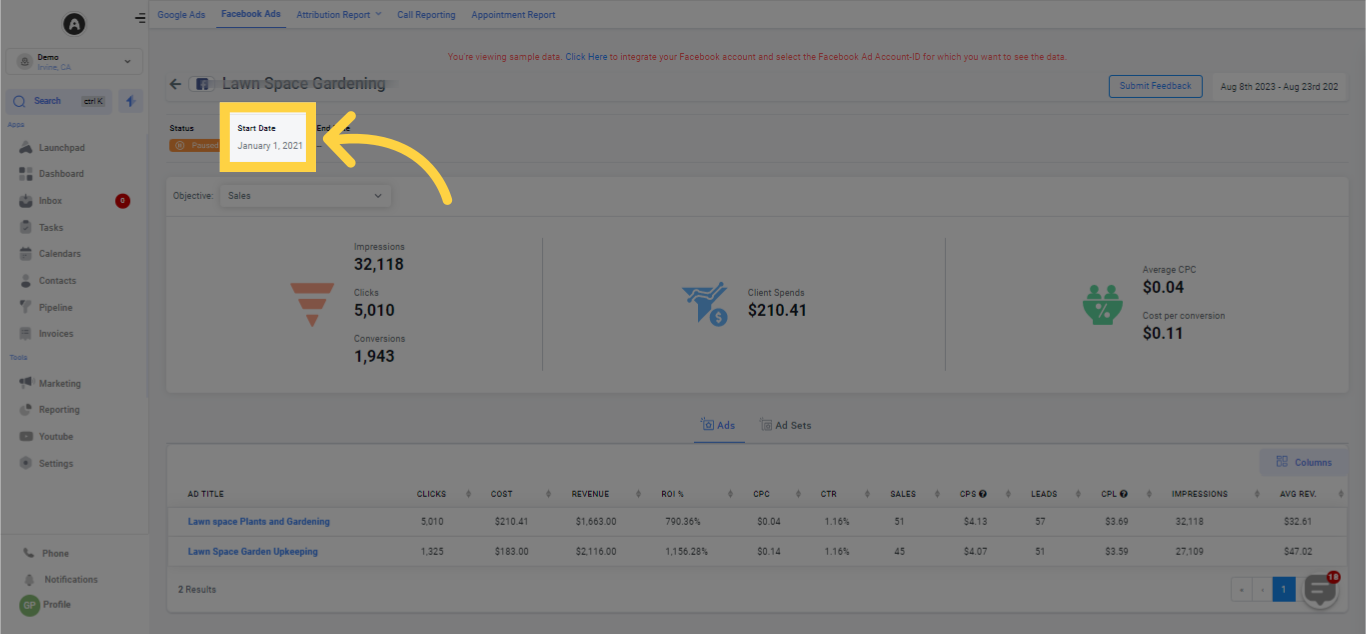
Start Date
Displays the kick-off date of the individual Facebook ad campaign.
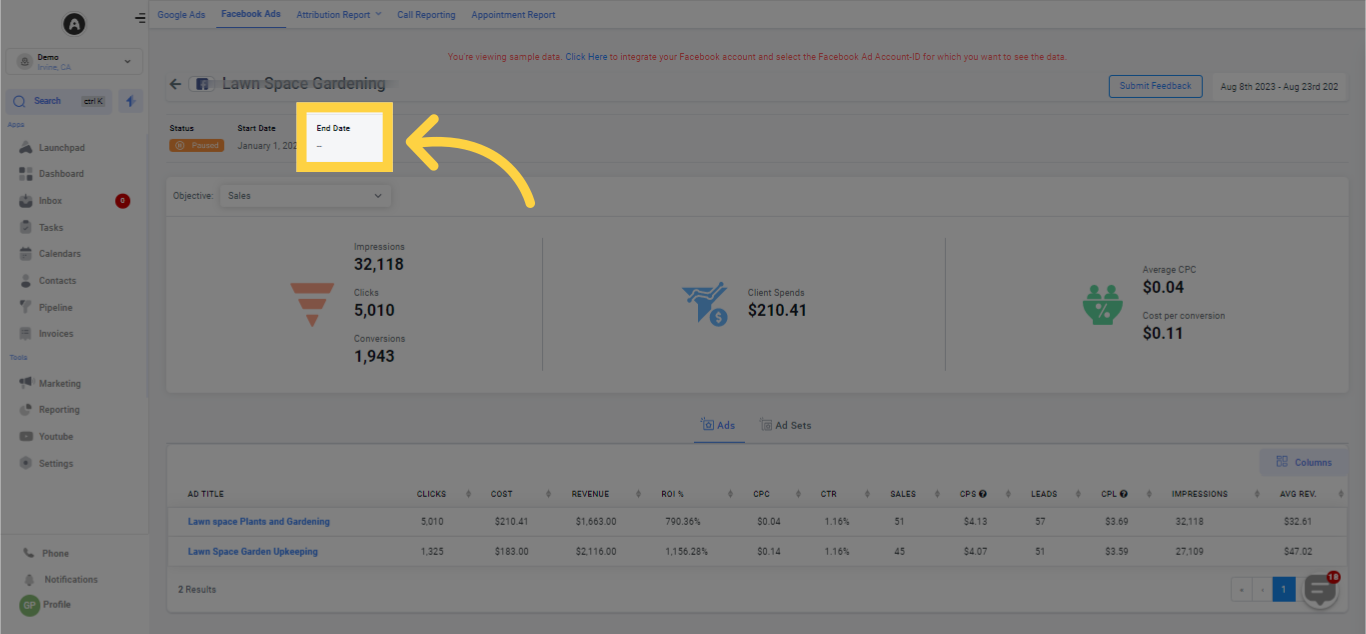
End Date
Indicates the date on which the individual Facebook ad campaign concluded.
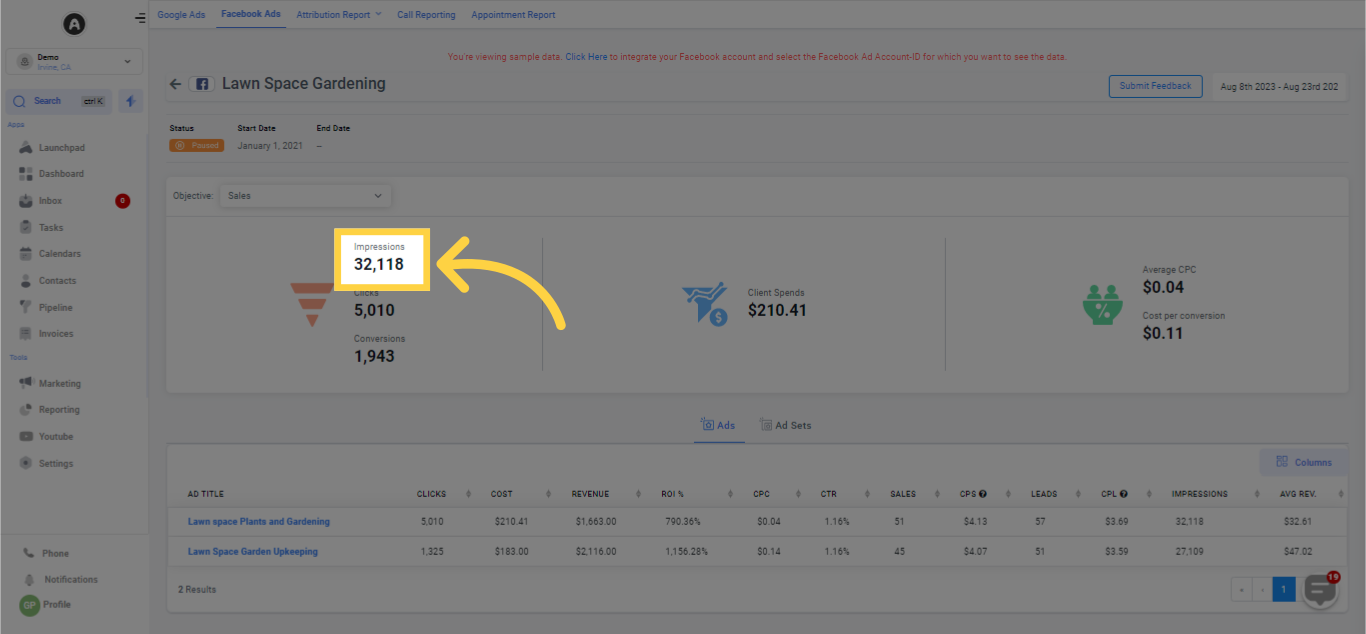
Impressions
Indicates the count of instances the Facebook ad from the selected campaign was displayed during a particular time span.
Clicks
Indicates the count of times the Facebook ad from the chosen campaign was clicked.
Conversions
Indicates the number of instances the Facebook ad achieved the intended result, based on the objective and settings.
Client Spends
Displays the total expenditure incurred on the Facebook ad campaign.
Average CPC
Shows the average Cost Per Click (CPC) for the selected Facebook ad campaign.
Cost Per Conversion
Displays the cost per conversion for the chosen Facebook ad campaign.
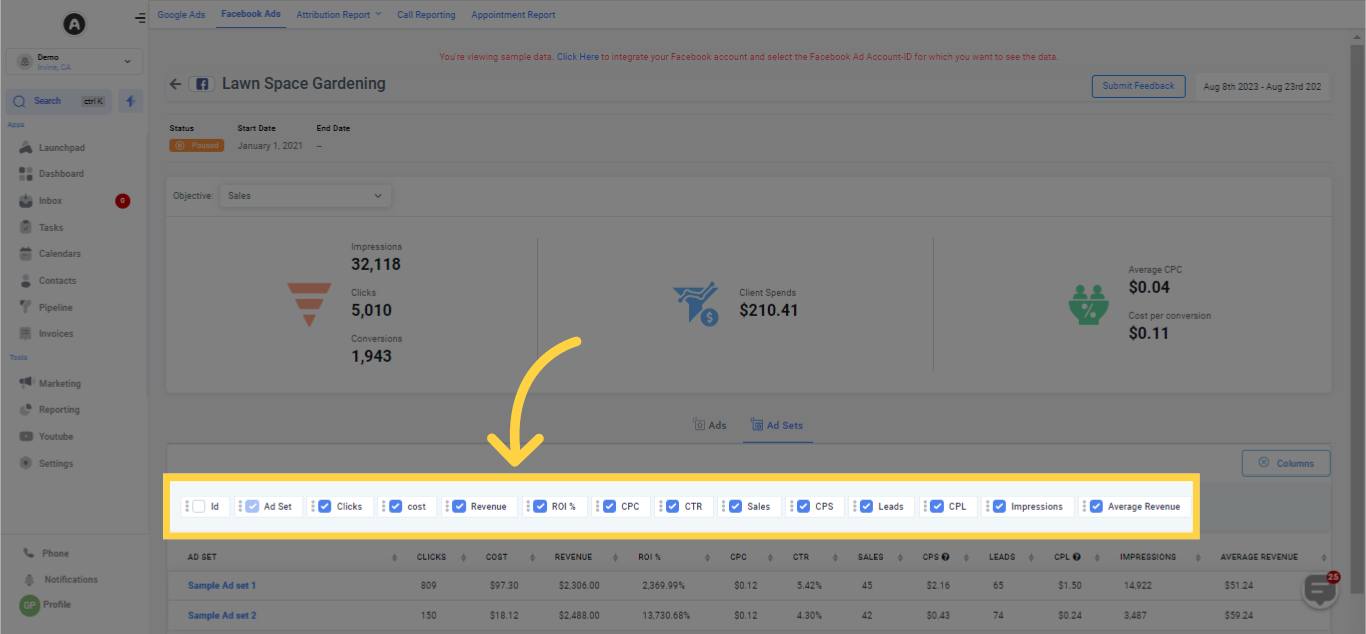
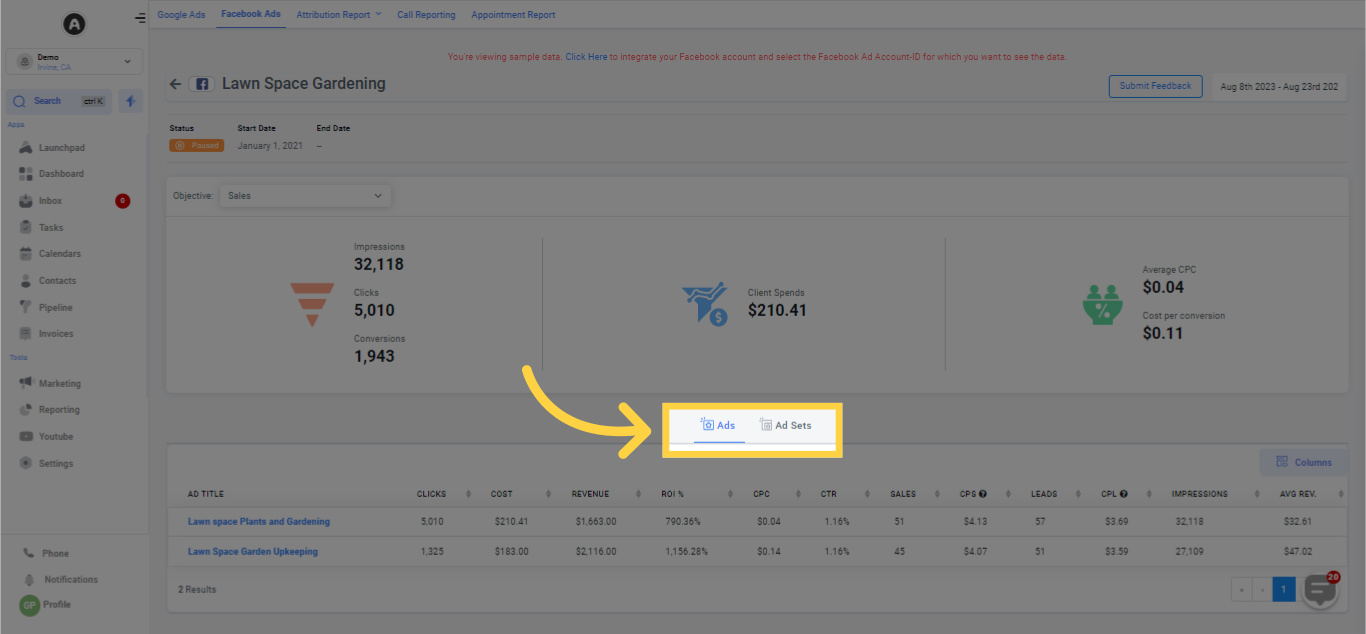
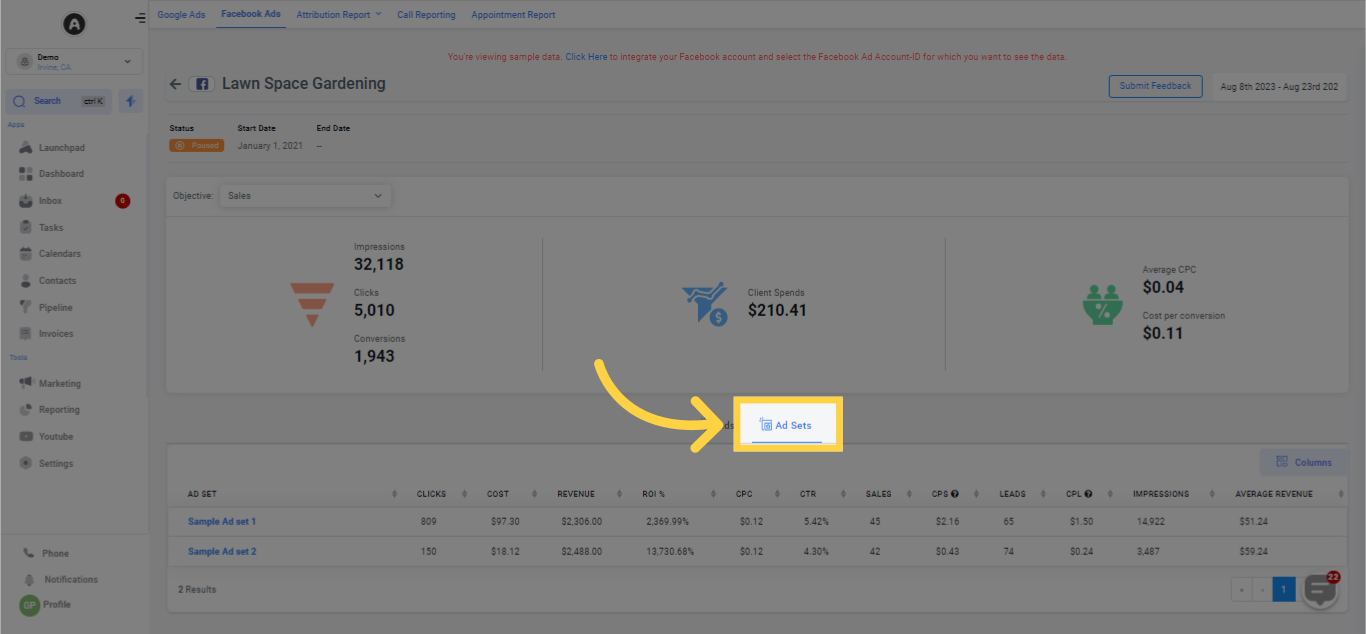
17. Facebook Ads Reporting Type
Reporting Types supply data pertaining to the ads and ad sets utilized in a Facebook ad campaign. Effortlessly view ad statistics at a macro or micro level according to your preferences!
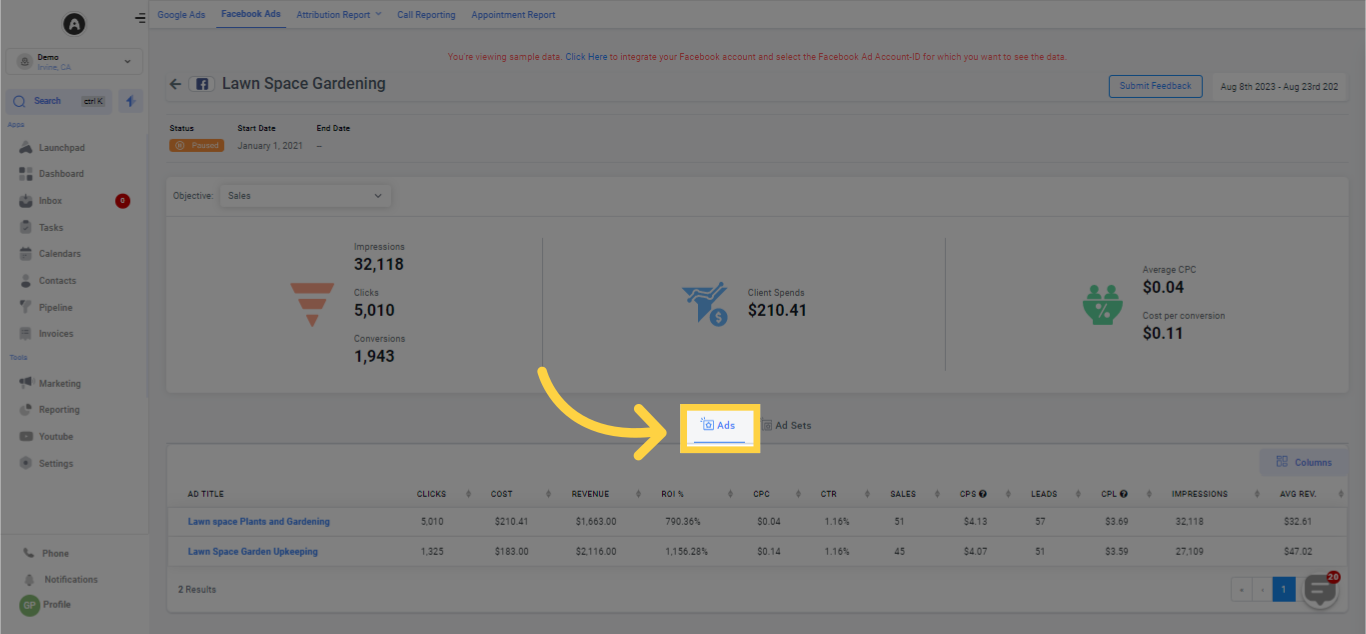
Ads
Click "Columns"
Column Options
Click "Ad Sets"
Click "Columns"
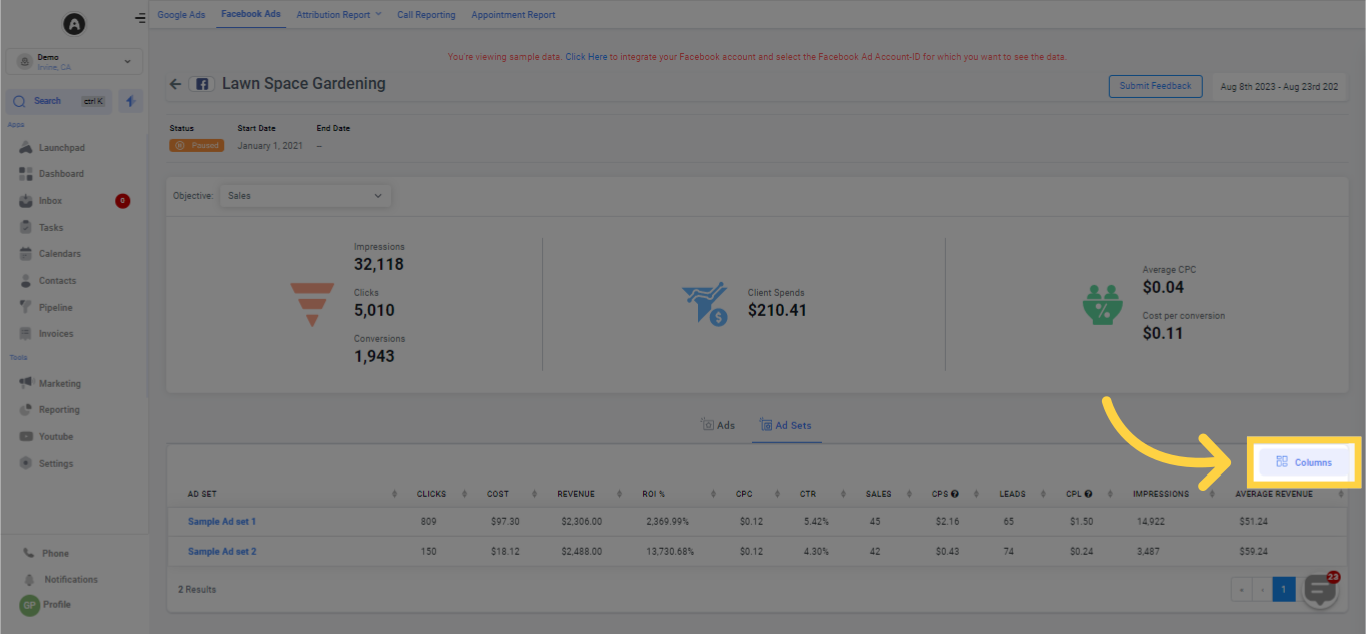
Column Options