Attribution Conversion Report
The Attribution Conversion Report section empowers users to monitor and scrutinize revenue generated and the aggregate proportion of sales using different metrics like contacts in the Customer Relationship Management (CRM) system, opportunities, and sessions.
This section is perfect for observing the effectiveness of lead conversion through different sales stages and quantifying the resultant revenue for the business.
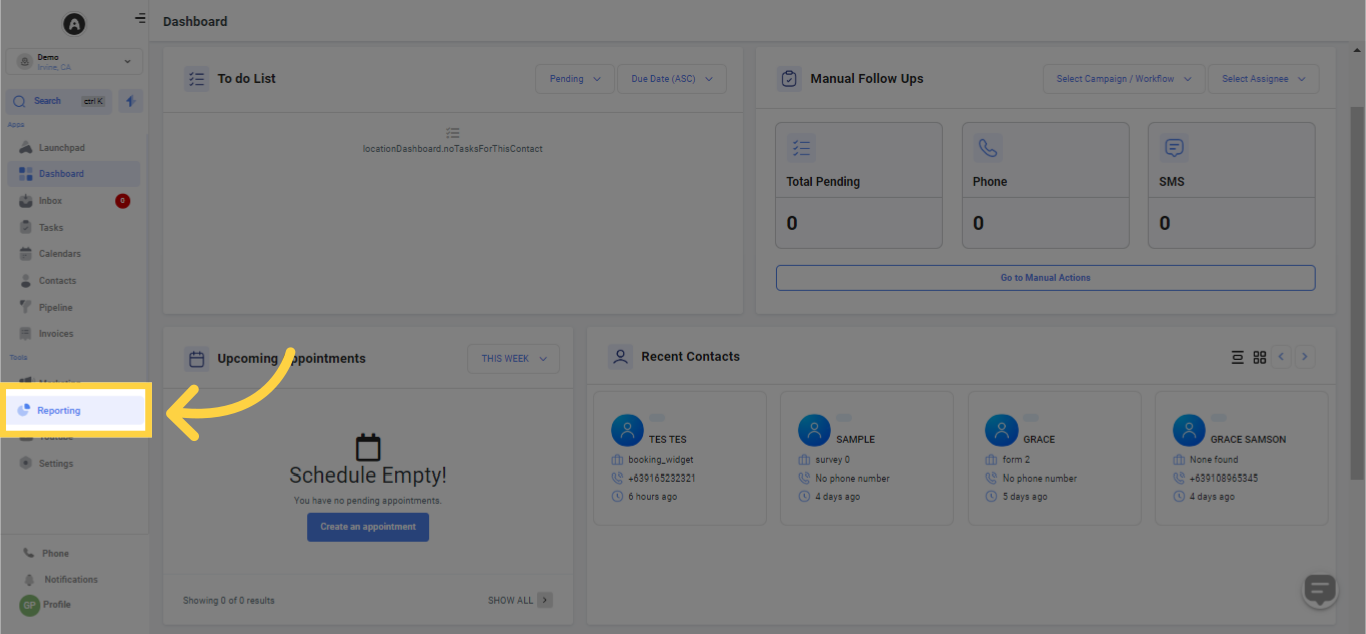
IMPORTANT: Your access to all components may vary based on your respective user permissions.1. Select "Reporting"
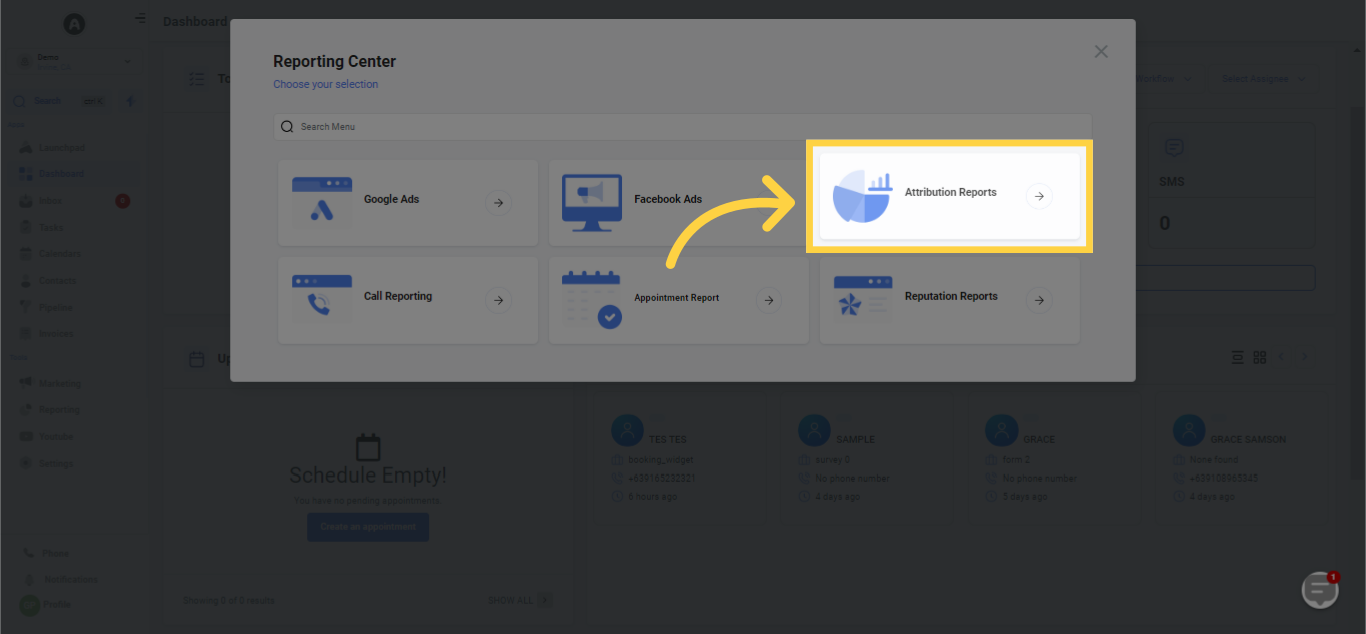
2. Select "Attribution Reports"
3. Choose Source Type
Choose the kind of data you want to incorporate into your attribution reports to garner useful insights that cater to your particular requirements. You have the flexibility to select from Forms, Surveys, or Calendars.
If you decide on Forms or Surveys, you can scrutinize the efficiency of numerous lead generation forms present on your website, and also judge the success of initiatives like customer feedback.
On the other hand, if you select Calendars, you have the ability to evaluate the influence of scheduled events and appointments on customer involvement and conversions.

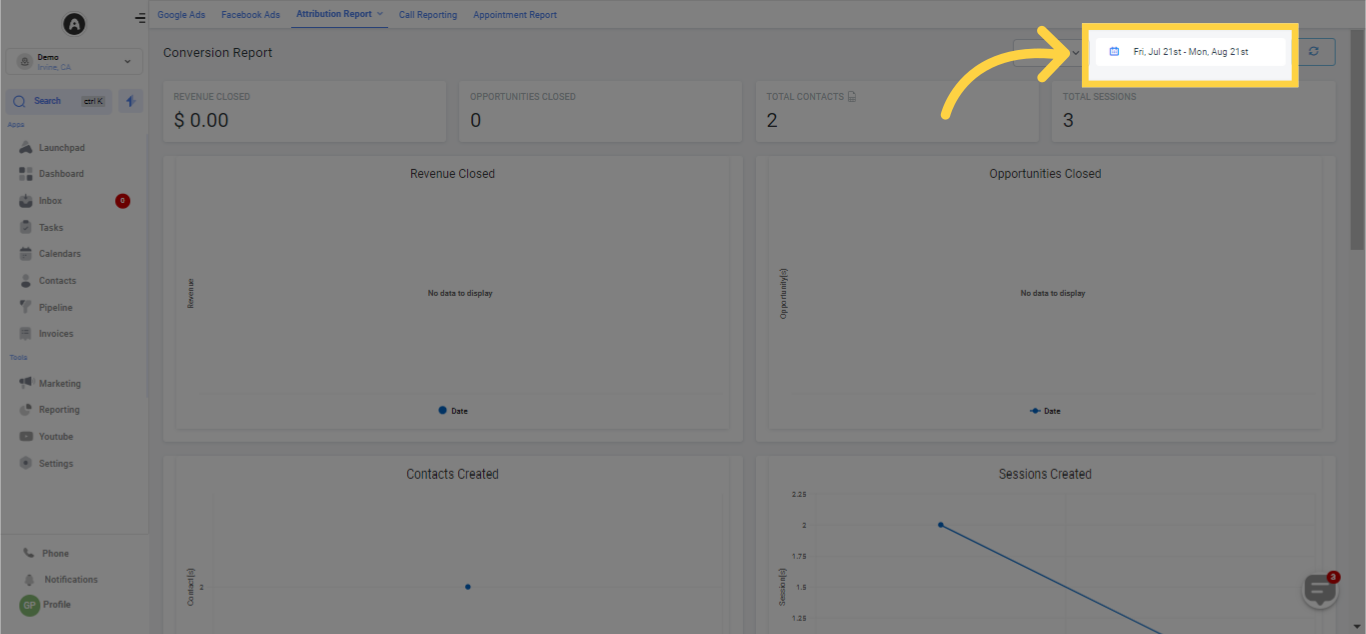
4. Select Date Range
For precise analysis of attribution data, it's essential for users to filter and establish specific date ranges using the Select Date Range button.
Just click on the calendar icon to choose your desired range of dates, then confirm your selection by clicking the green check mark button. This will update and display your data according to the selected timeline.
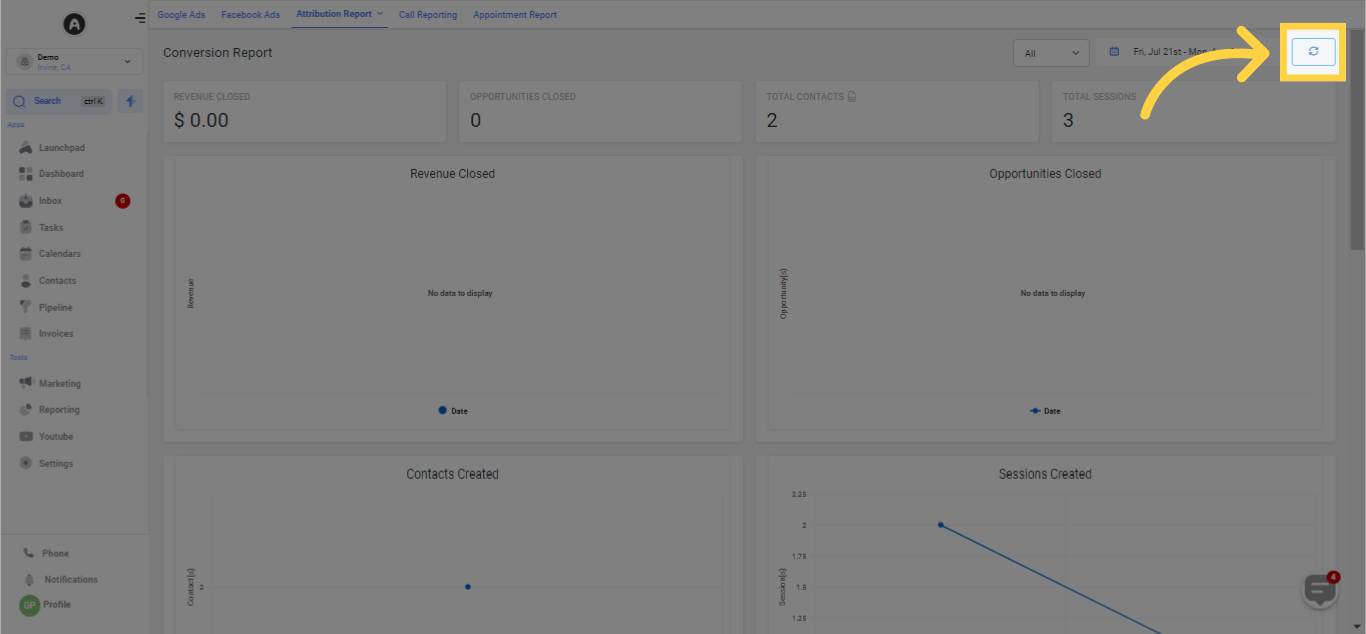
5. Refresh Data
Clicking on the refresh button allows for a swift update of all the below-displayed data and spares you from having to reload your entire browser tab or window.
This handy feature guarantees that you always have access to the latest and most precise reporting info, allowing you to make informed decisions based on real-time data without causing any interruptions to your workflow or compromising your user experience.
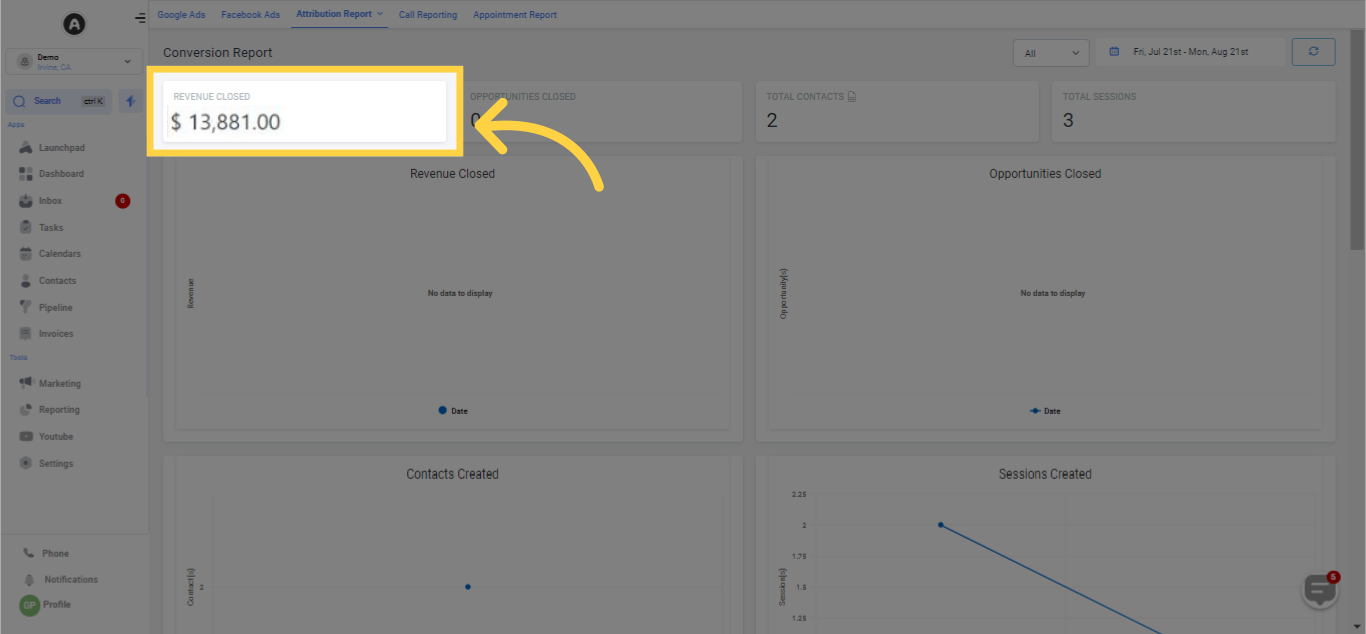
6. Revenue Closed
Keep track of the revenue your business has earned during a particular period to acquire significant insights into your financial performance.
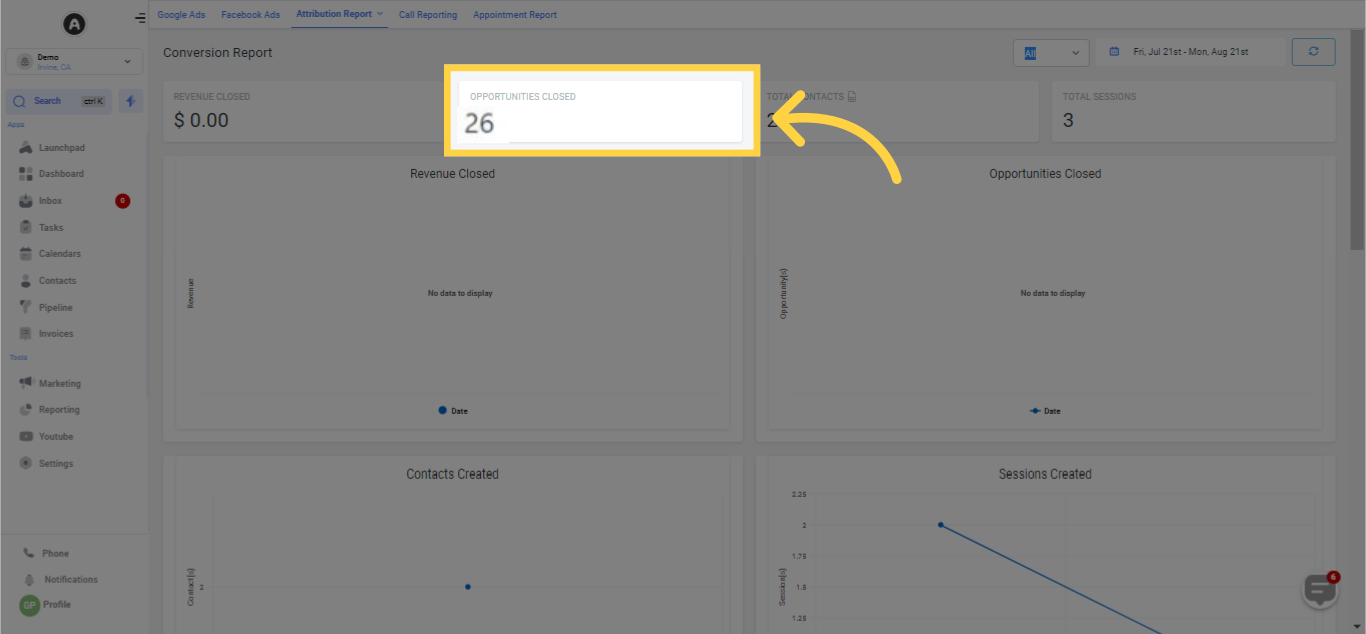
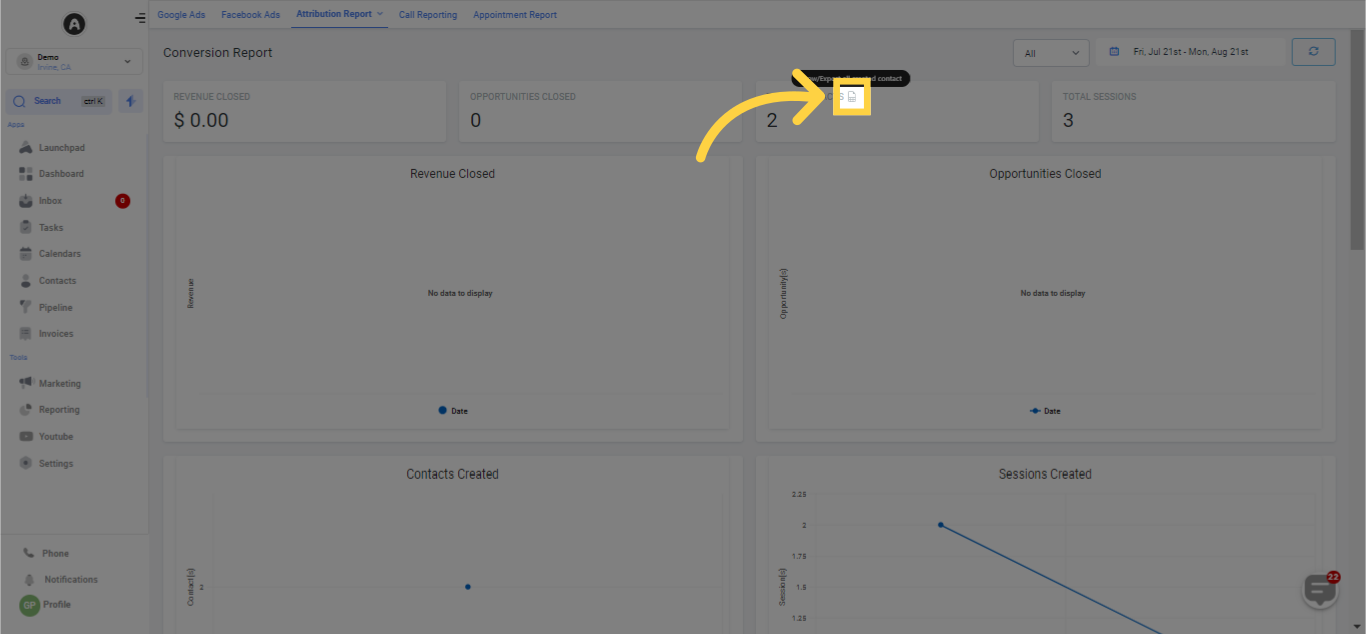
7. Opportunities Closed
Monitor the count of opportunities that you've effectively closed within a certain period to gauge your sales performance and conversion ratios.
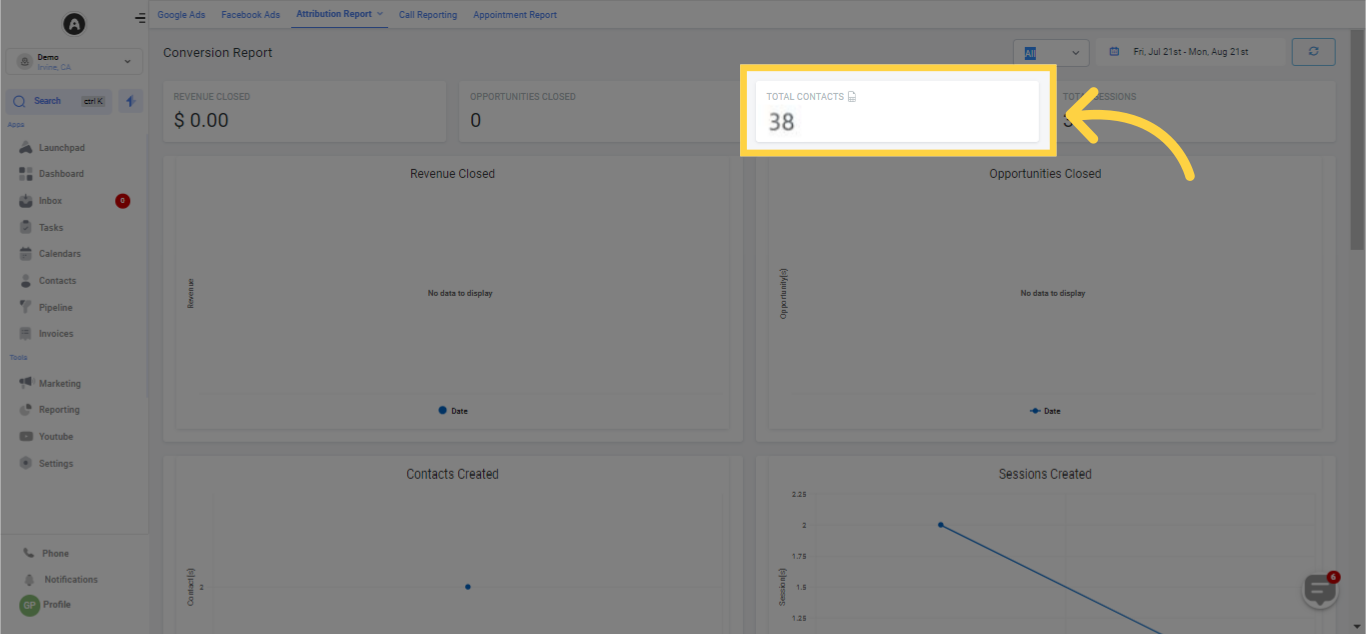
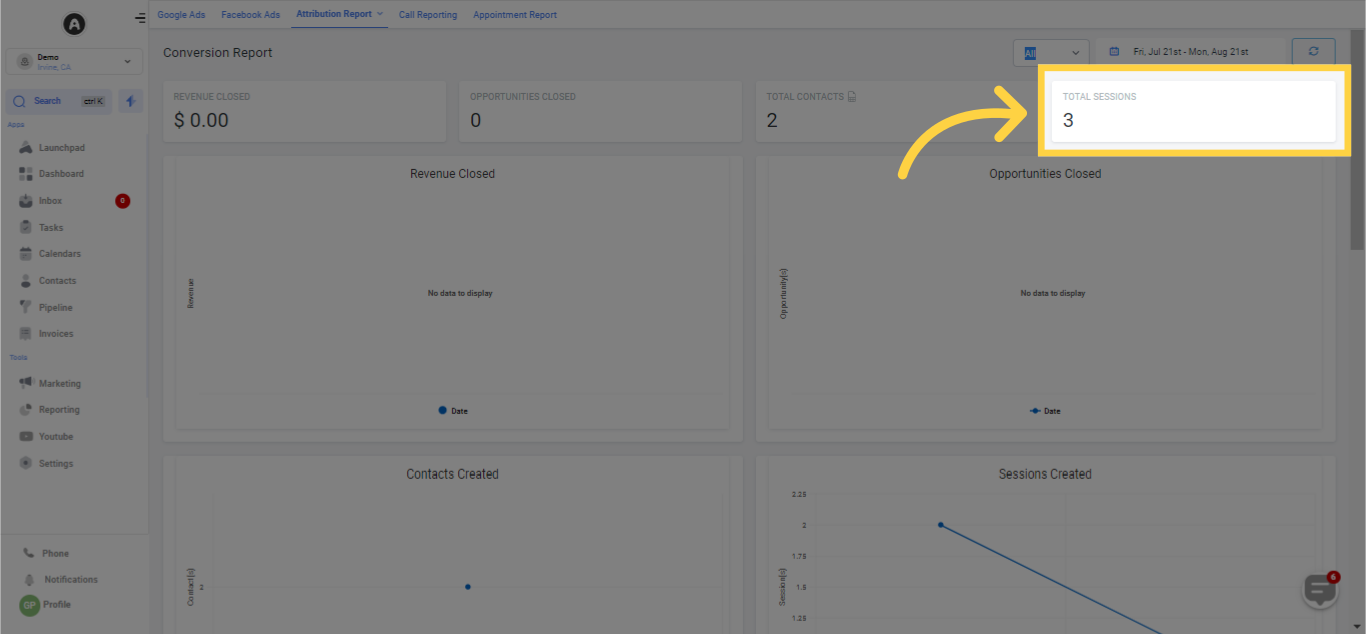
8. Total Contacts
Observe the quantity of contacts you've amassed over a particular period to evaluate the success of your lead generation strategies and marketing initiatives.
9. Total Sessions
The Total Sessions metric facilitates users in tracking the count of sessions formed over the chosen period, encompassing website traffic, forms, surveys, and calendar visits.
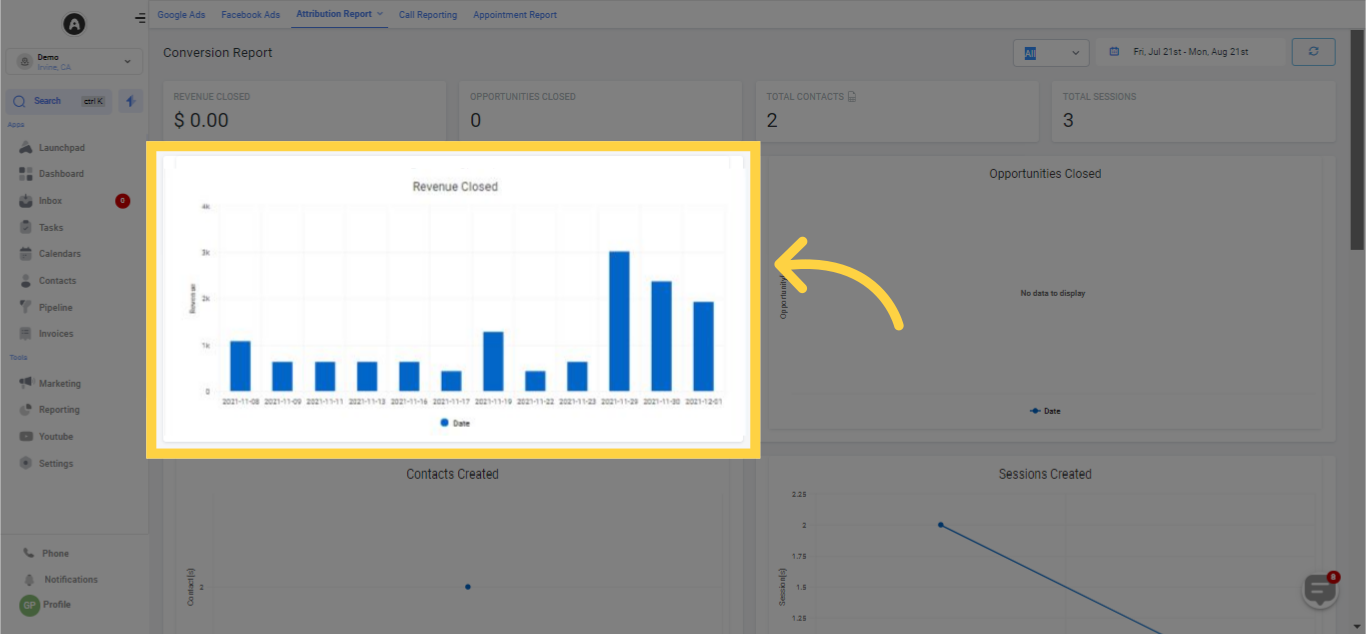
10. Revenue Closed - Timeline
Within the Revenue Closed - Timeline section, users get to see a chronological representation of the revenue generated during a determined interval. This visual changes as users modify the date range displayed in the top right corner of the interface.
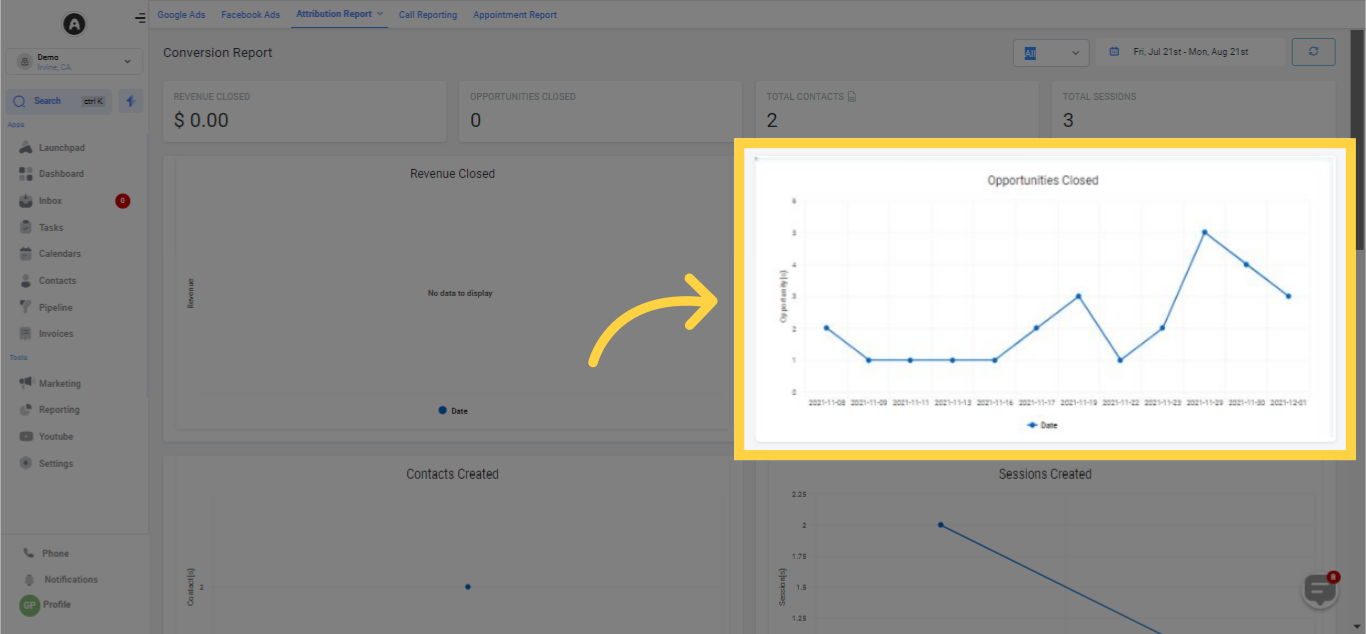
11. Opportunities Closed - Timeline
The Opportunities Closed - Timeline section presents a chronological depiction of closed opportunities throughout the chosen span, which alters as users tweak the date range.
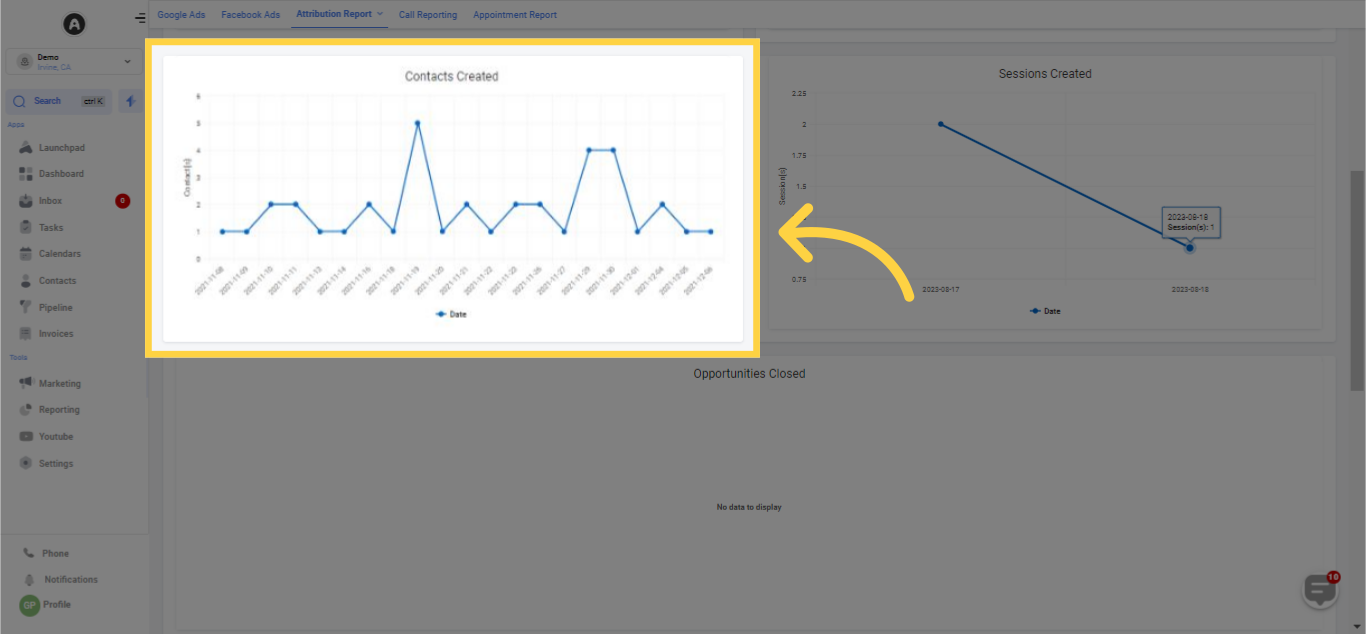
12. Contacts Created - Timeline
Within the Contacts Created - Timeline section, users can view a temporal representation of contacts created throughout a specified timeframe. This timeline adjusts in accordance with changes made to the date range found in the top right corner of the interface.
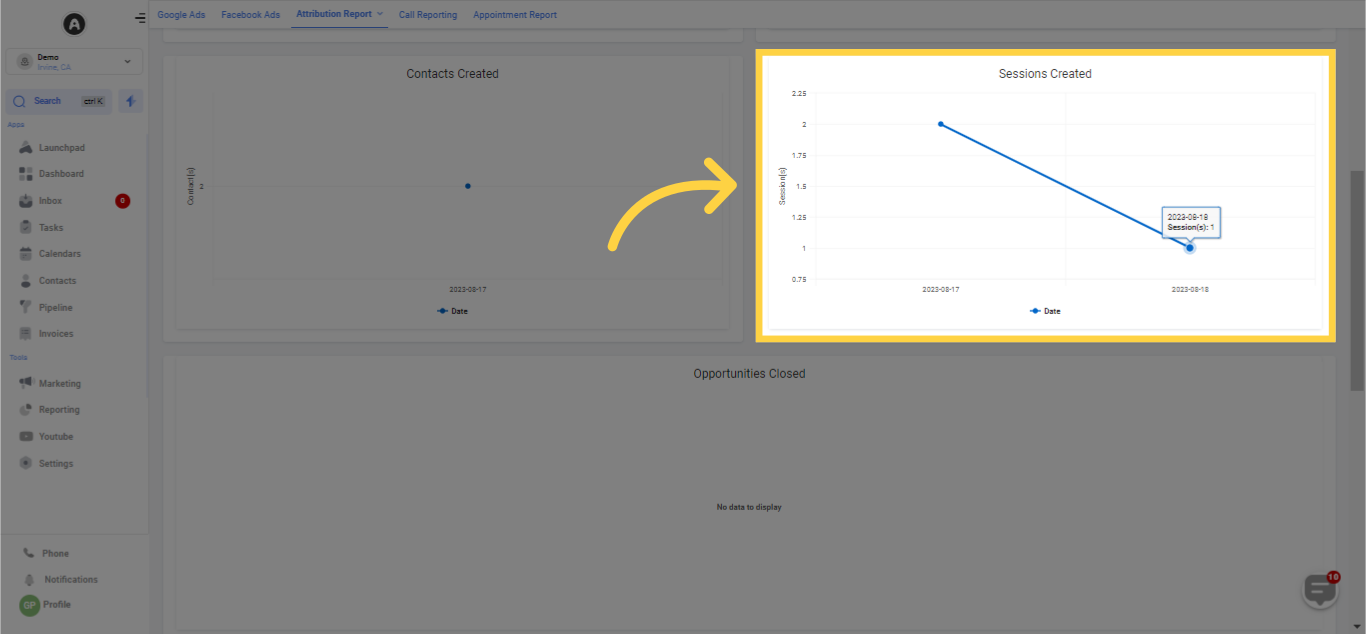
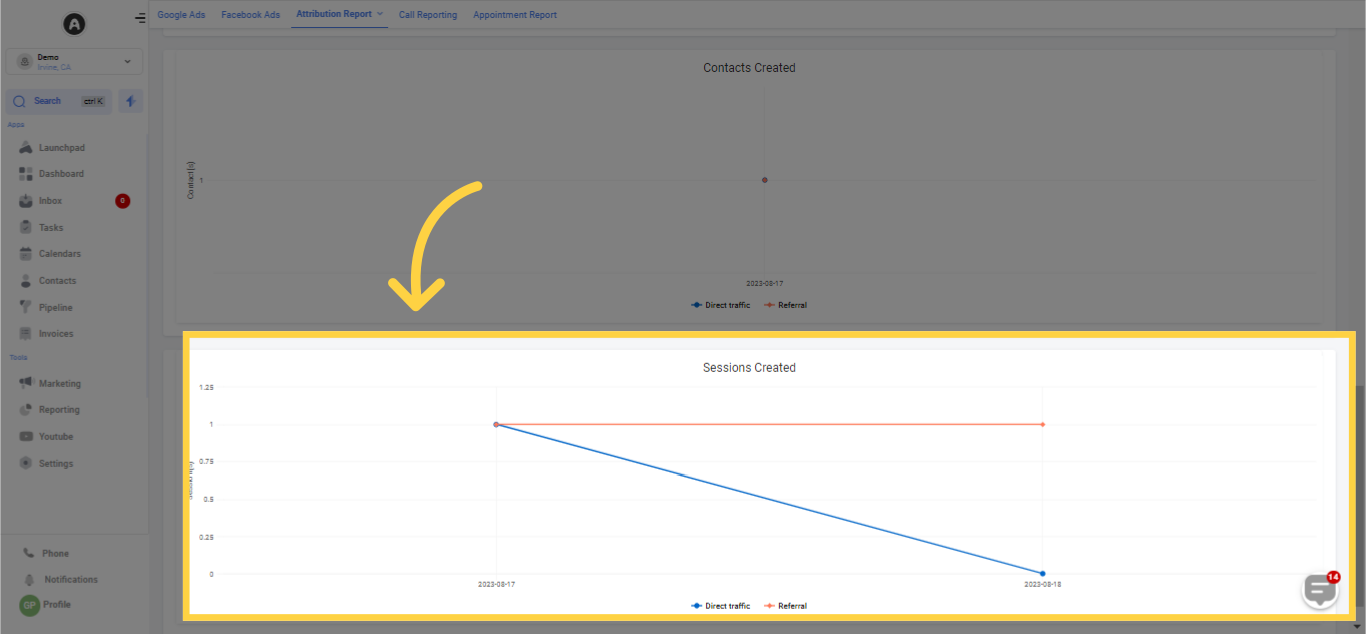
13. Sessions Created - Timeline
The Sessions Created - Timeline section showcases a chronology of sessions created throughout the chosen span, which encompasses website traffic, forms, surveys, and calendar visits.
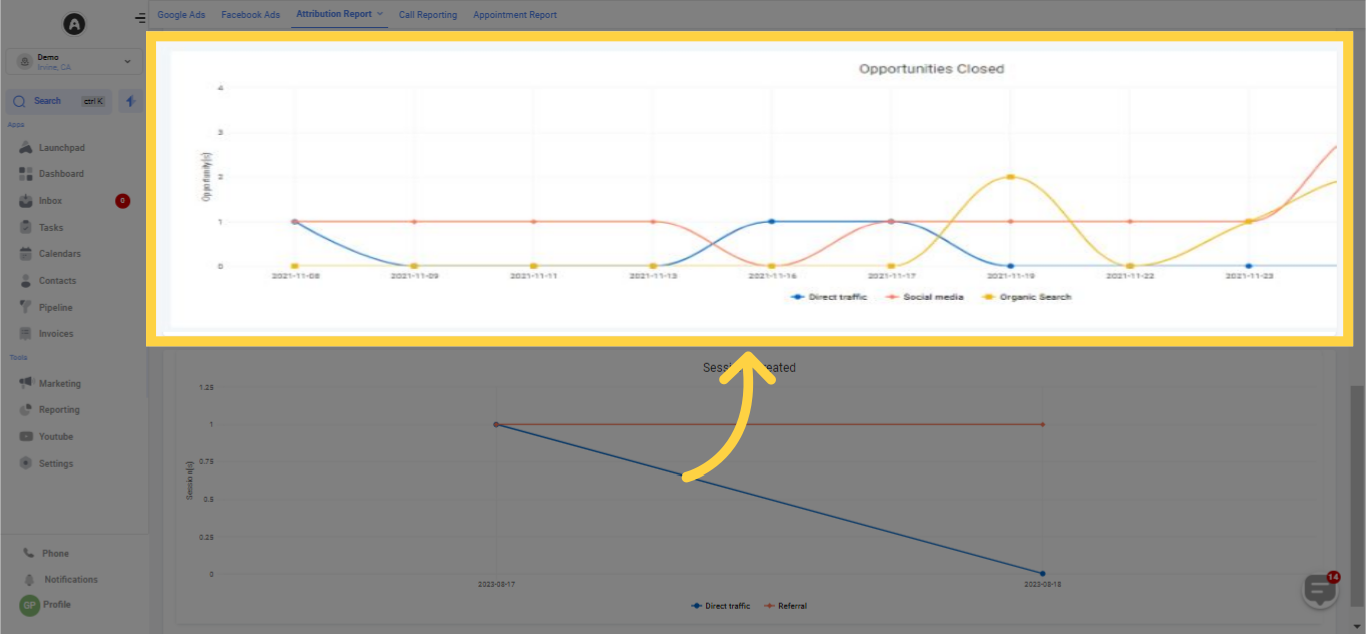
14. Opportunities Closed- Traffic
The Opportunities Closed graph depicts a timeline of the opportunities you've successfully closed and their origins.
You can seamlessly trace the traffic sources leading to these closures, such as Organic Search from search engines like Google and Yahoo, Social Media channels like Facebook and Twitter, and Direct Traffic.
These traffic sources are shown on a timeline, and you can alter the date range in the top-right corner of the screen to modify the displayed information.
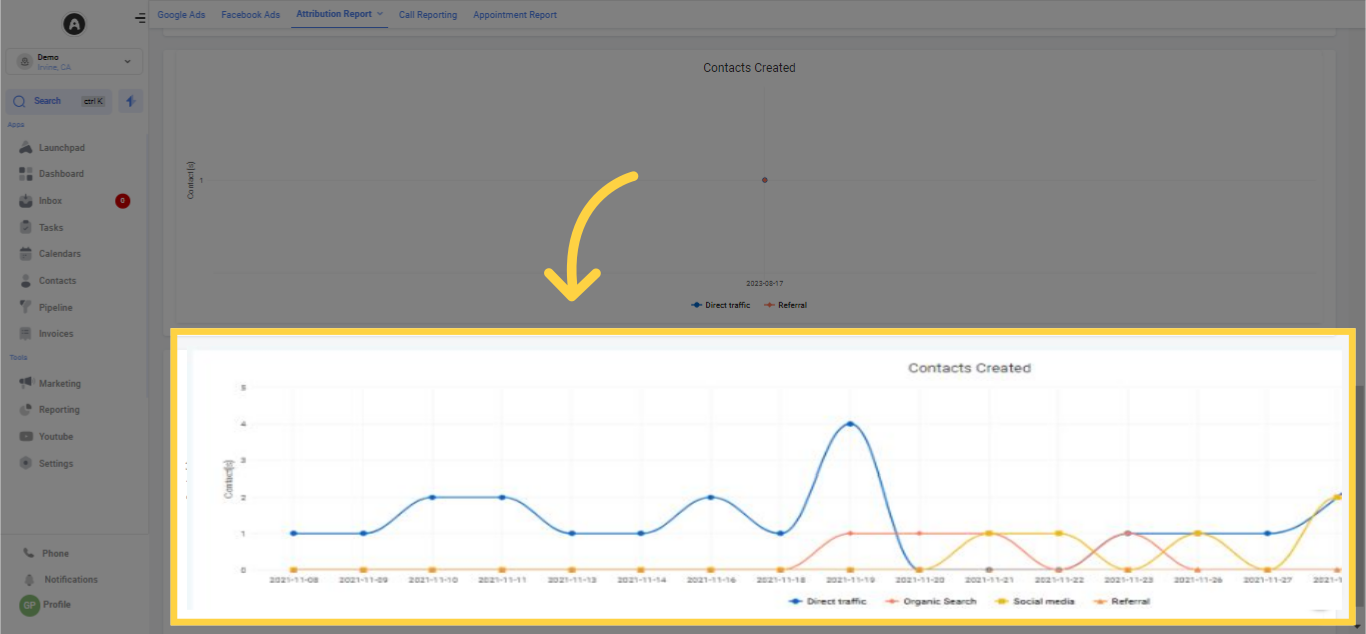
15. Contacts Created - Traffic
The Contacts Created graph presents a temporal array of contacts you've established, along with their respective traffic sources.
These traffic sources encompass Organic Search from search engines such as Google and Yahoo, Social Media platforms like Facebook and Twitter, and Direct Traffic.
These traffic origins are exhibited on a timeline that adjusts according to the modification of the date range you toggle in the top right corner of the screen.
16. Sessions Created - Traffic Source
The Sessions Created graph exhibits a timeline of the sessions you've created and the originating traffic sources.
These sources comprise of Organic Search from search engines such as Google and Yahoo, Social Media outlets like Facebook and Twitter, as well as Direct Traffic.
The timeline updates corresponding to changes you make in the date range, located in the top-right corner of the screen, reflecting alterations in the traffic source.
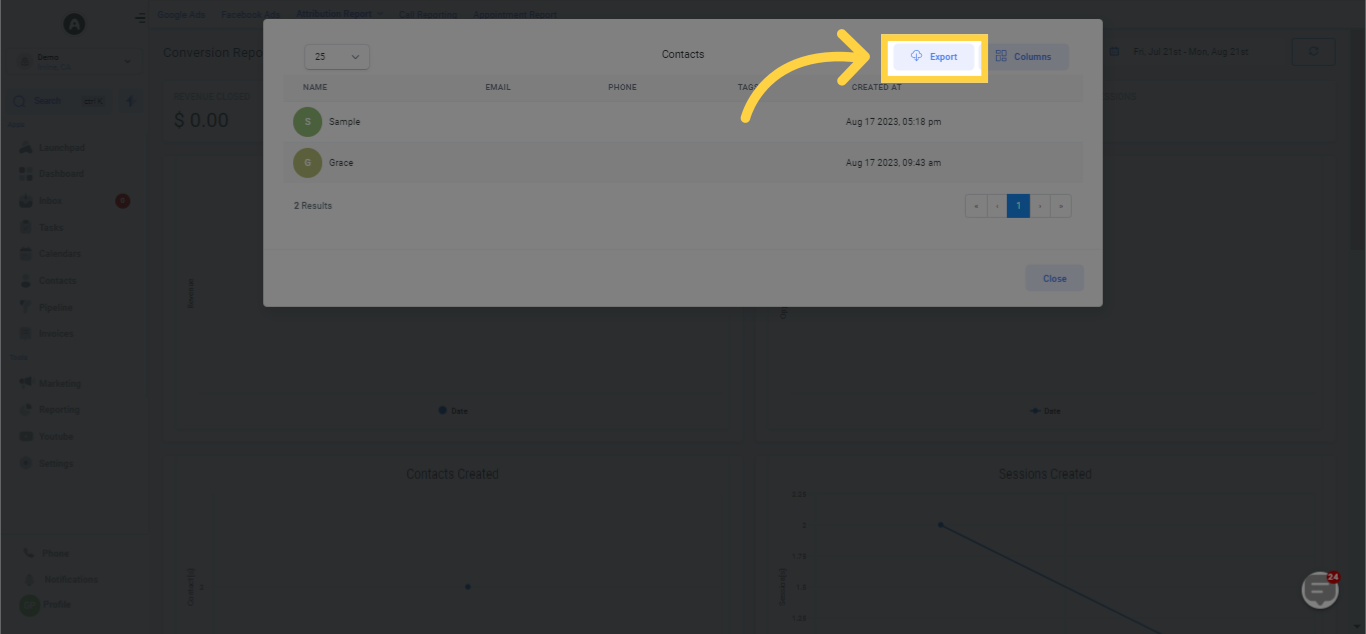
17. Click to Show/Export Data
Utilizing the Show/Export Data icon, you can access a list of contacts generated within a specific period and export this data to an Excel sheet.
This identical feature is usable for monitoring closed opportunities, enabling you to identify which opportunities were finalized during a particular timeframe and export this data to an Excel sheet as well.
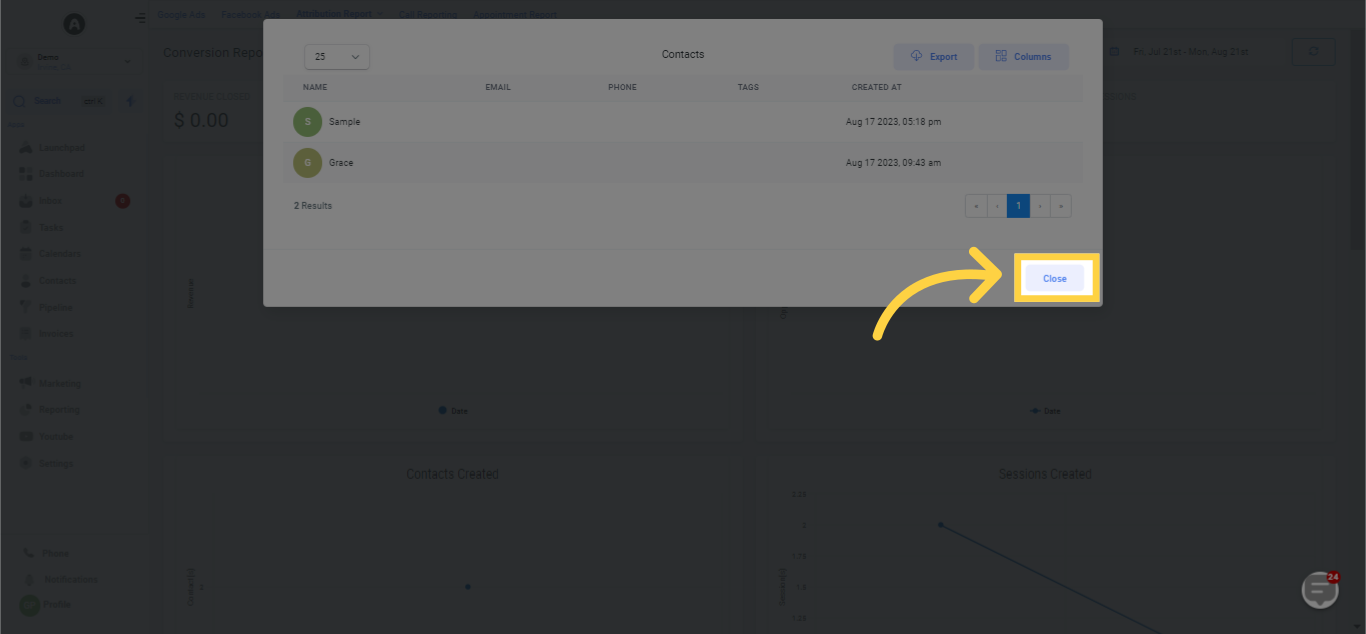
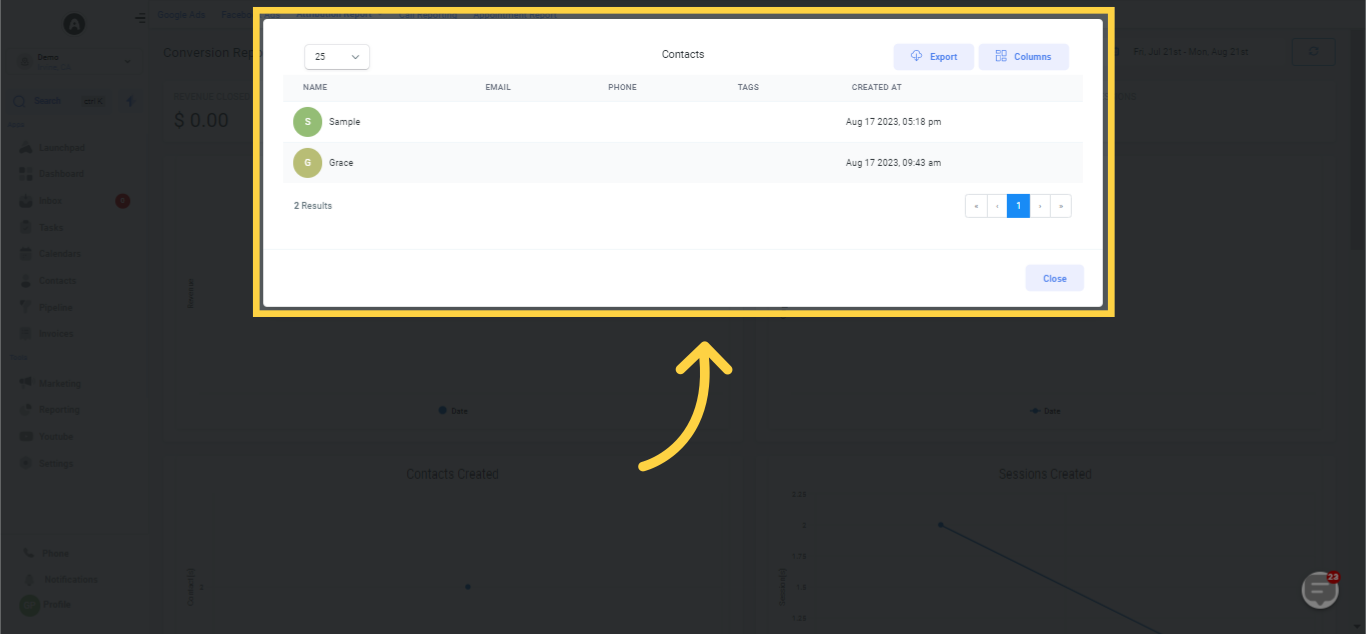
18. List of Contacts
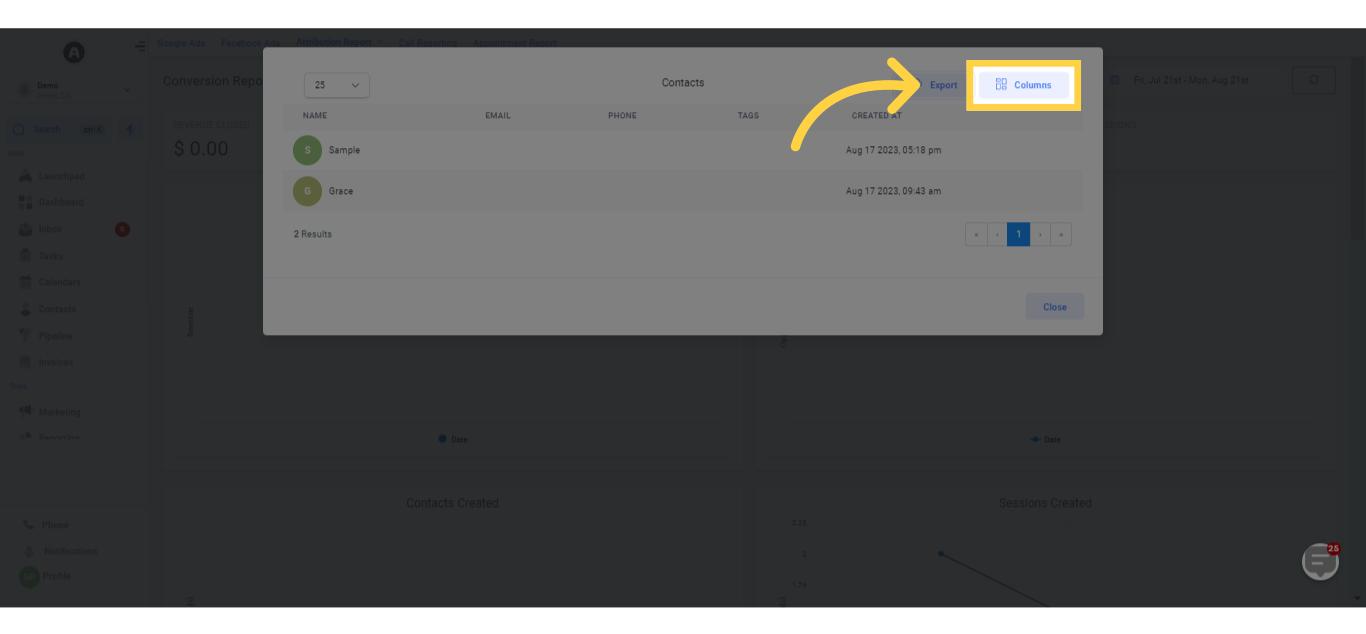
19. Click "Columns" to filter columns to show
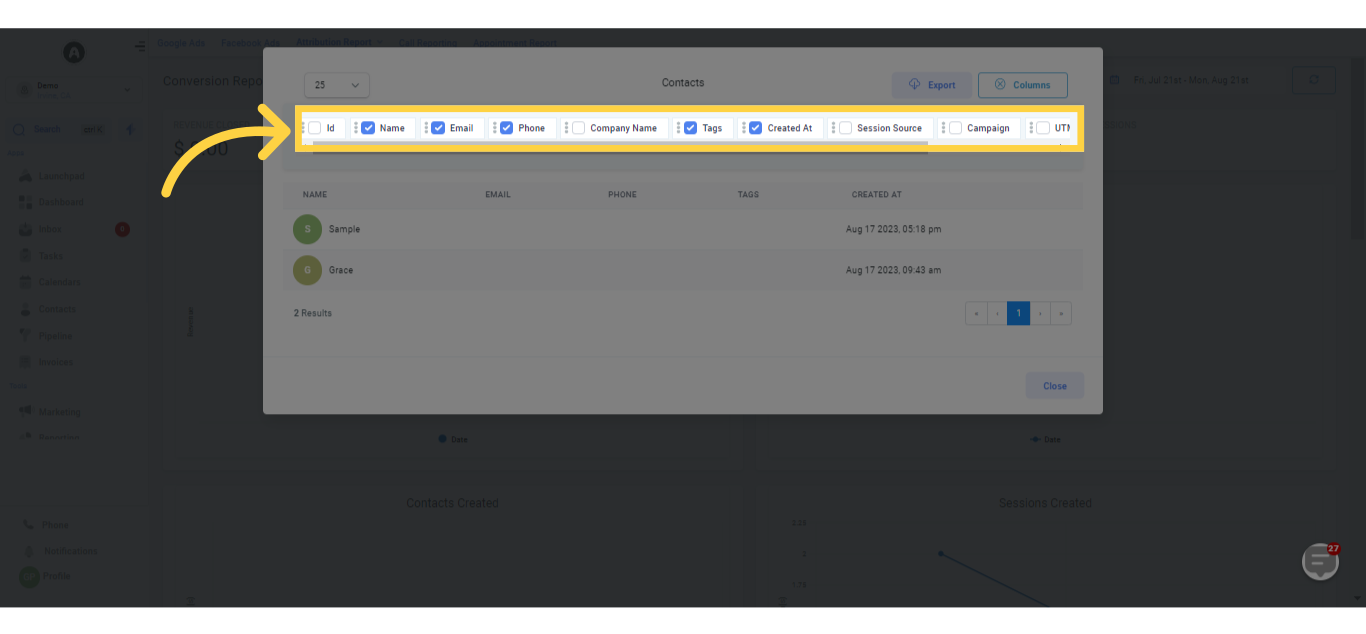
20. Choose Columns to show
21. Click here to Export Contacts
22. Close once done